Eclipse Day Cloud Forecast
Happy Eclipse Day!
I know I said I wasn’t going to make a final forecast, but I had a few extra minutes this morning and couldn’t resist.
Eclipse Day Mean

Links to the original content:
https://weather.us/model-charts/euro/usa/total-cloud-coverage/20240408-1800z.html
https://weather.us/model-charts/gfs-hd/usa/total-cloud-coverage/20240408-1800z.html
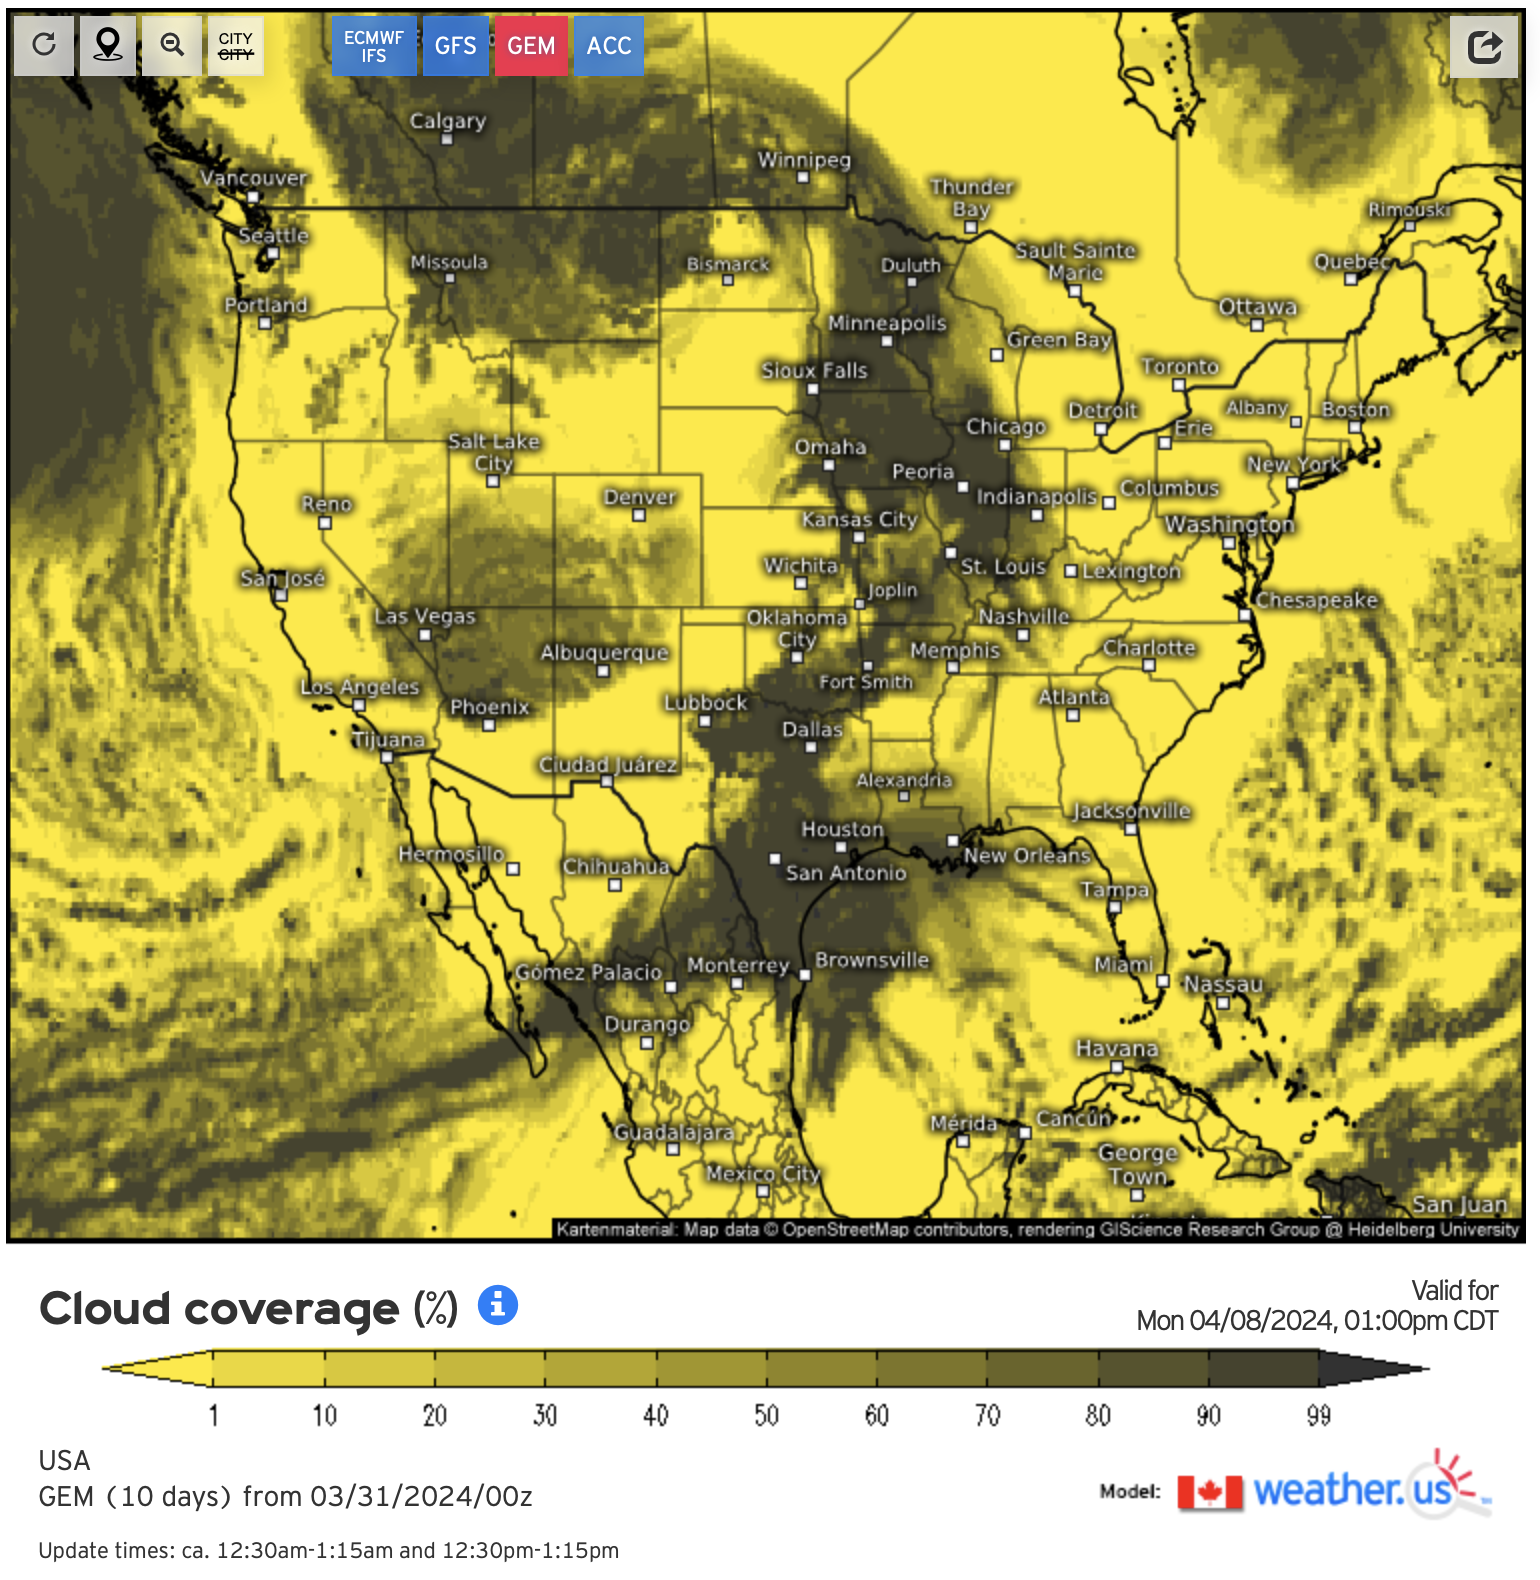
https://weather.us/model-charts/german/usa/total-cloud-coverage/20240408-1800z.html
https://weather.us/model-charts/can/usa/total-cloud-coverage/20240408-1800z.html
https://weather.us/model-charts/aus/usa/total-cloud-coverage/20240408-1800z.html
https://weather.us/model-charts/jpn/usa/total-cloud-coverage/20240408-1800z.html
https://weather.us/model-charts/french/usa/total-cloud-coverage/20240408-1800z.html
https://weather.us/model-charts/cma/usa/total-cloud-coverage/20240408-1800z.html
https://weather.us/model-charts/can-regional/usa/total-cloud-coverage/20240408-1800z.html
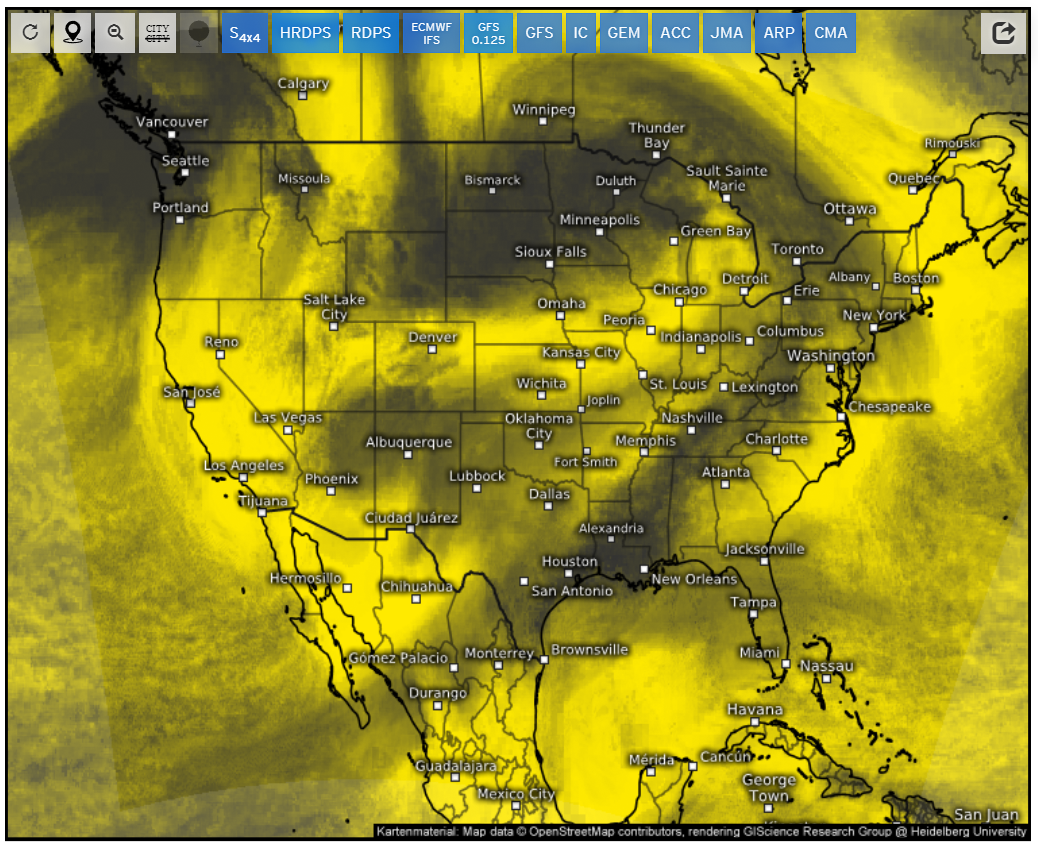
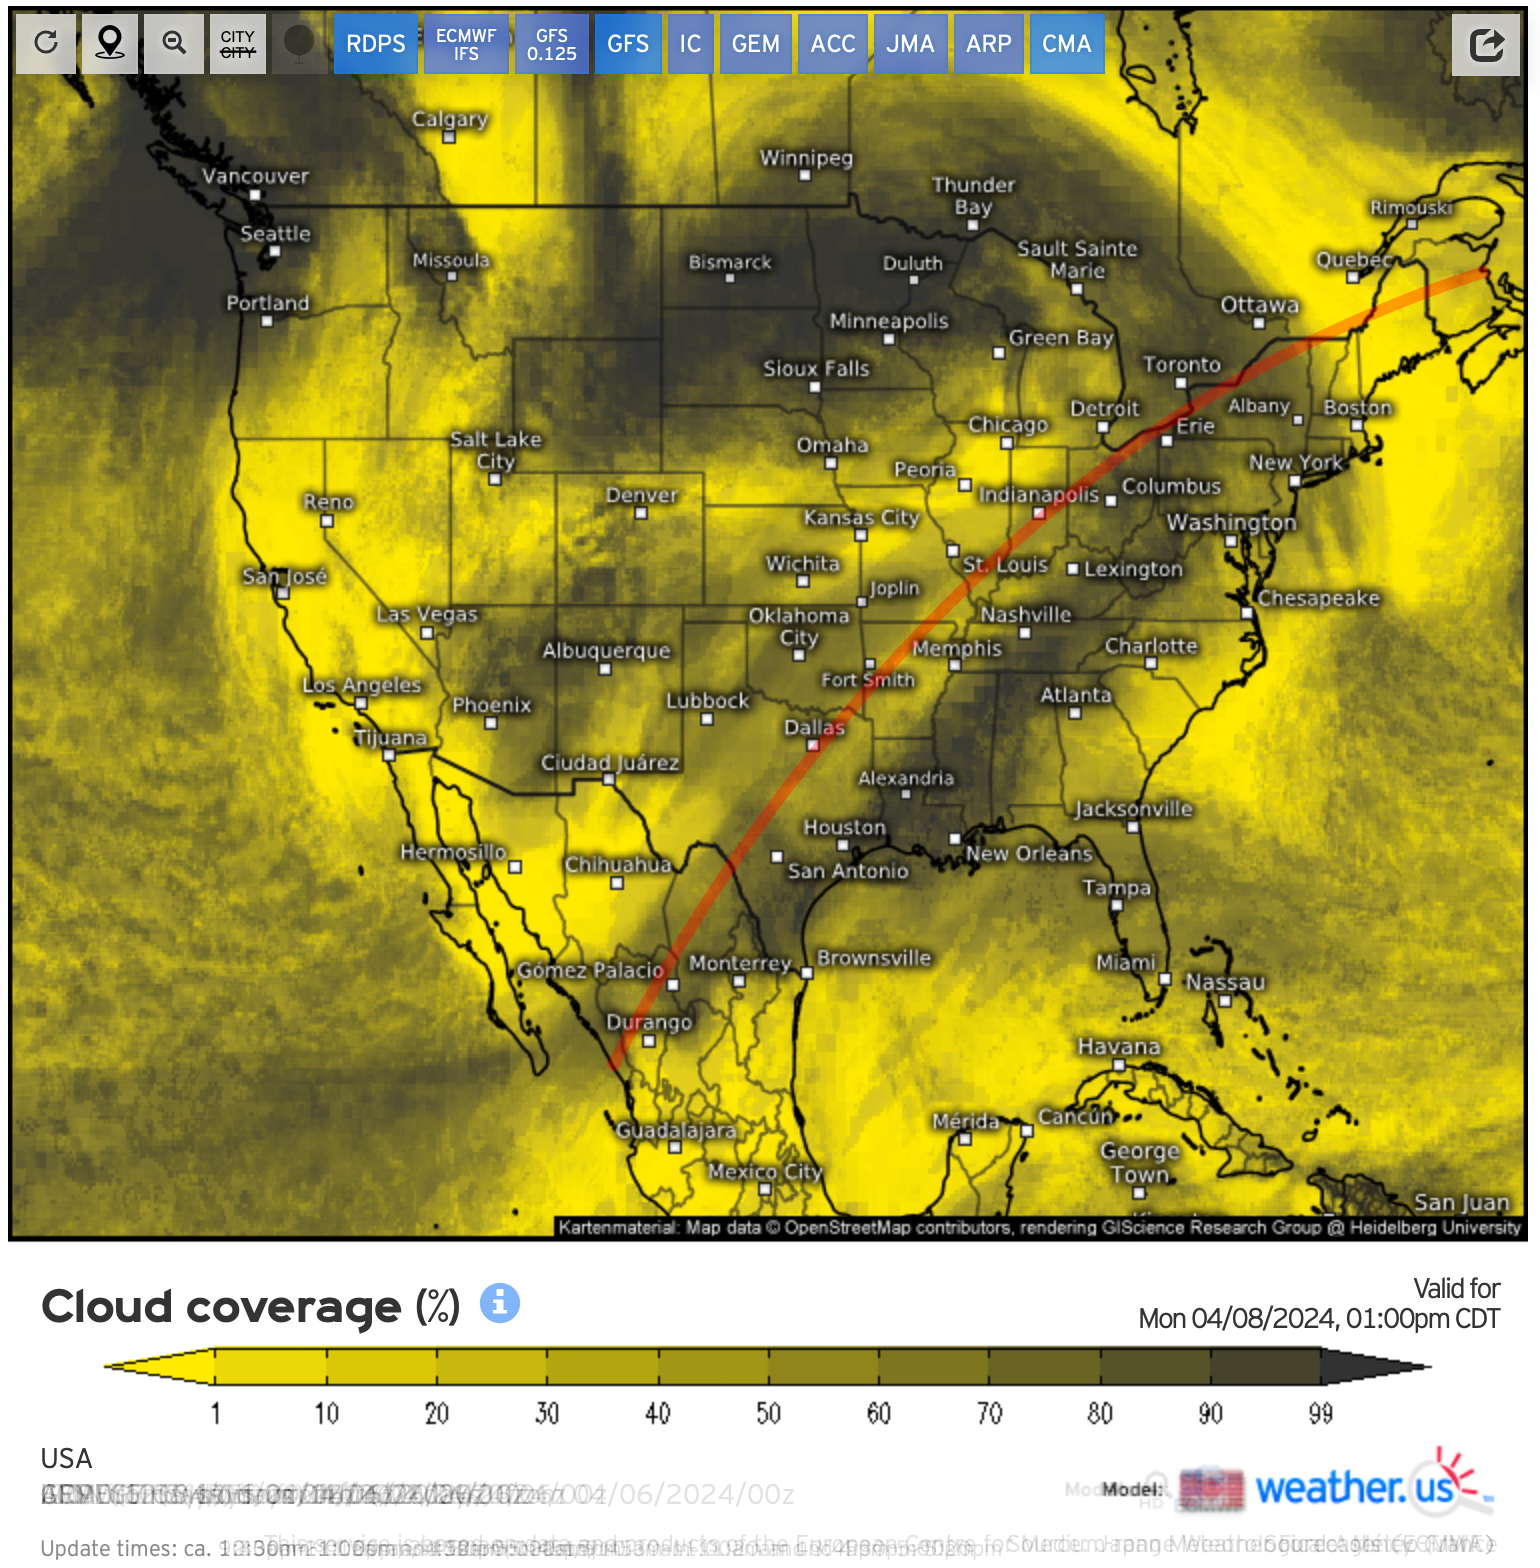
Well, this is it - the final cloud cover mean map for 2024.
Not much has changed in the last few hours, with the exception of perhaps a slightly improved forecast in Arkansas and Southern Missouri.
Patchy clouds will dominate most of the range of totality, and it is imperative that you be alert and mobile with regards to the clouds. A few miles / kilometers can make all the difference!
Eclipse Day Maximum

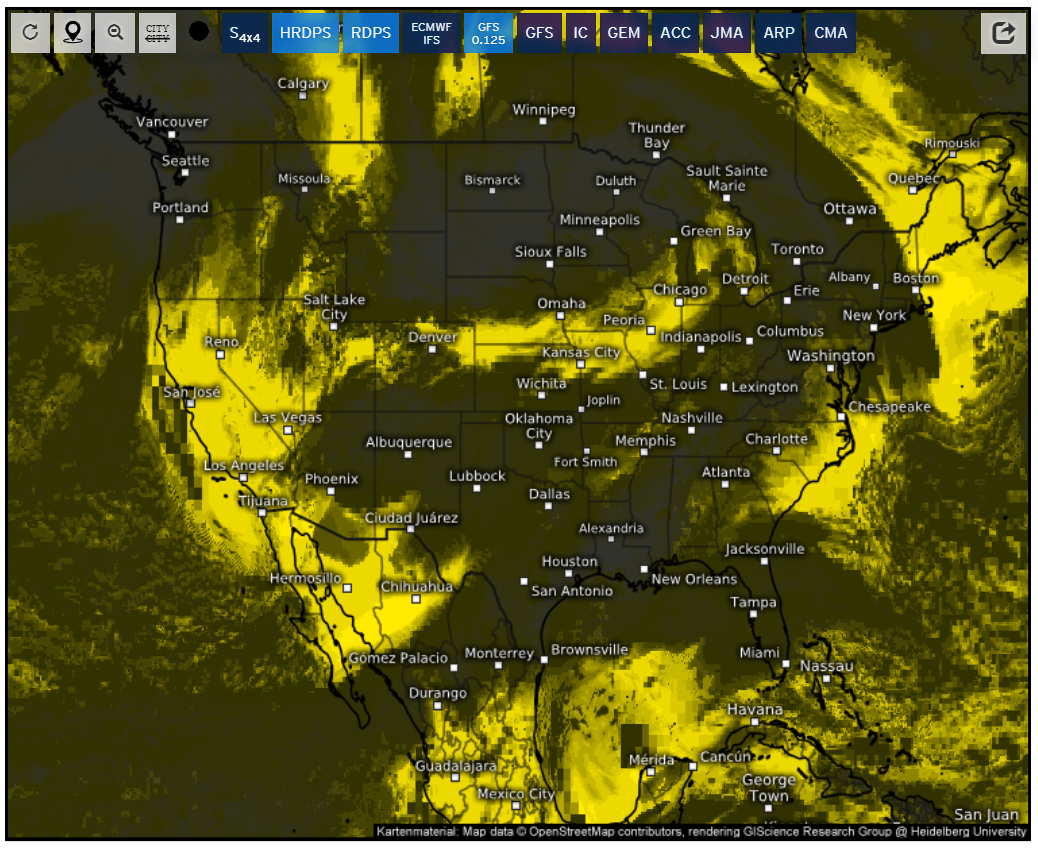
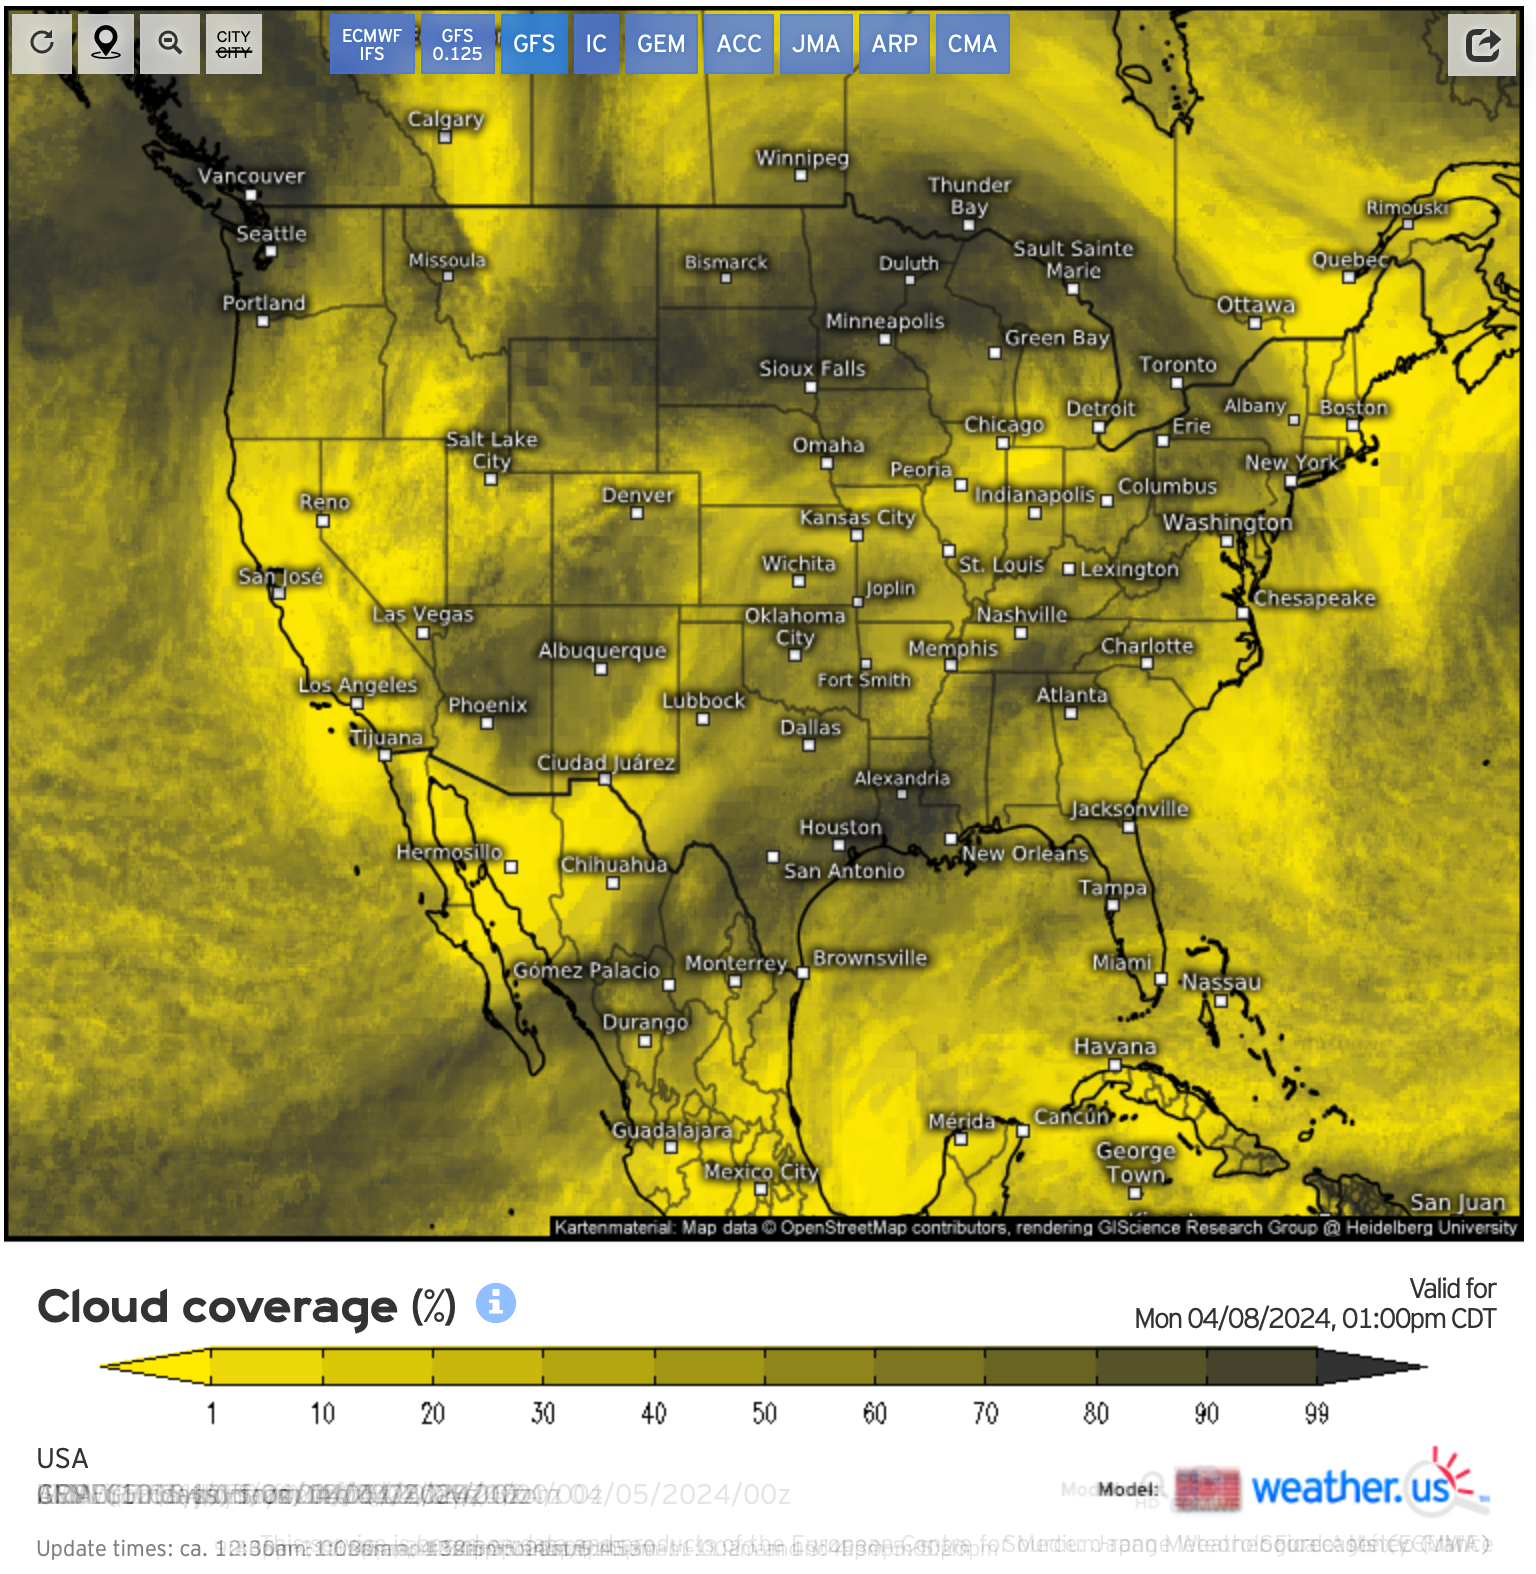
As before, a look at the maximum map (where yellow indicates at least one forecast calling for cloudless skies) indicates there’s a chance for nearly everyone along the line of totality.
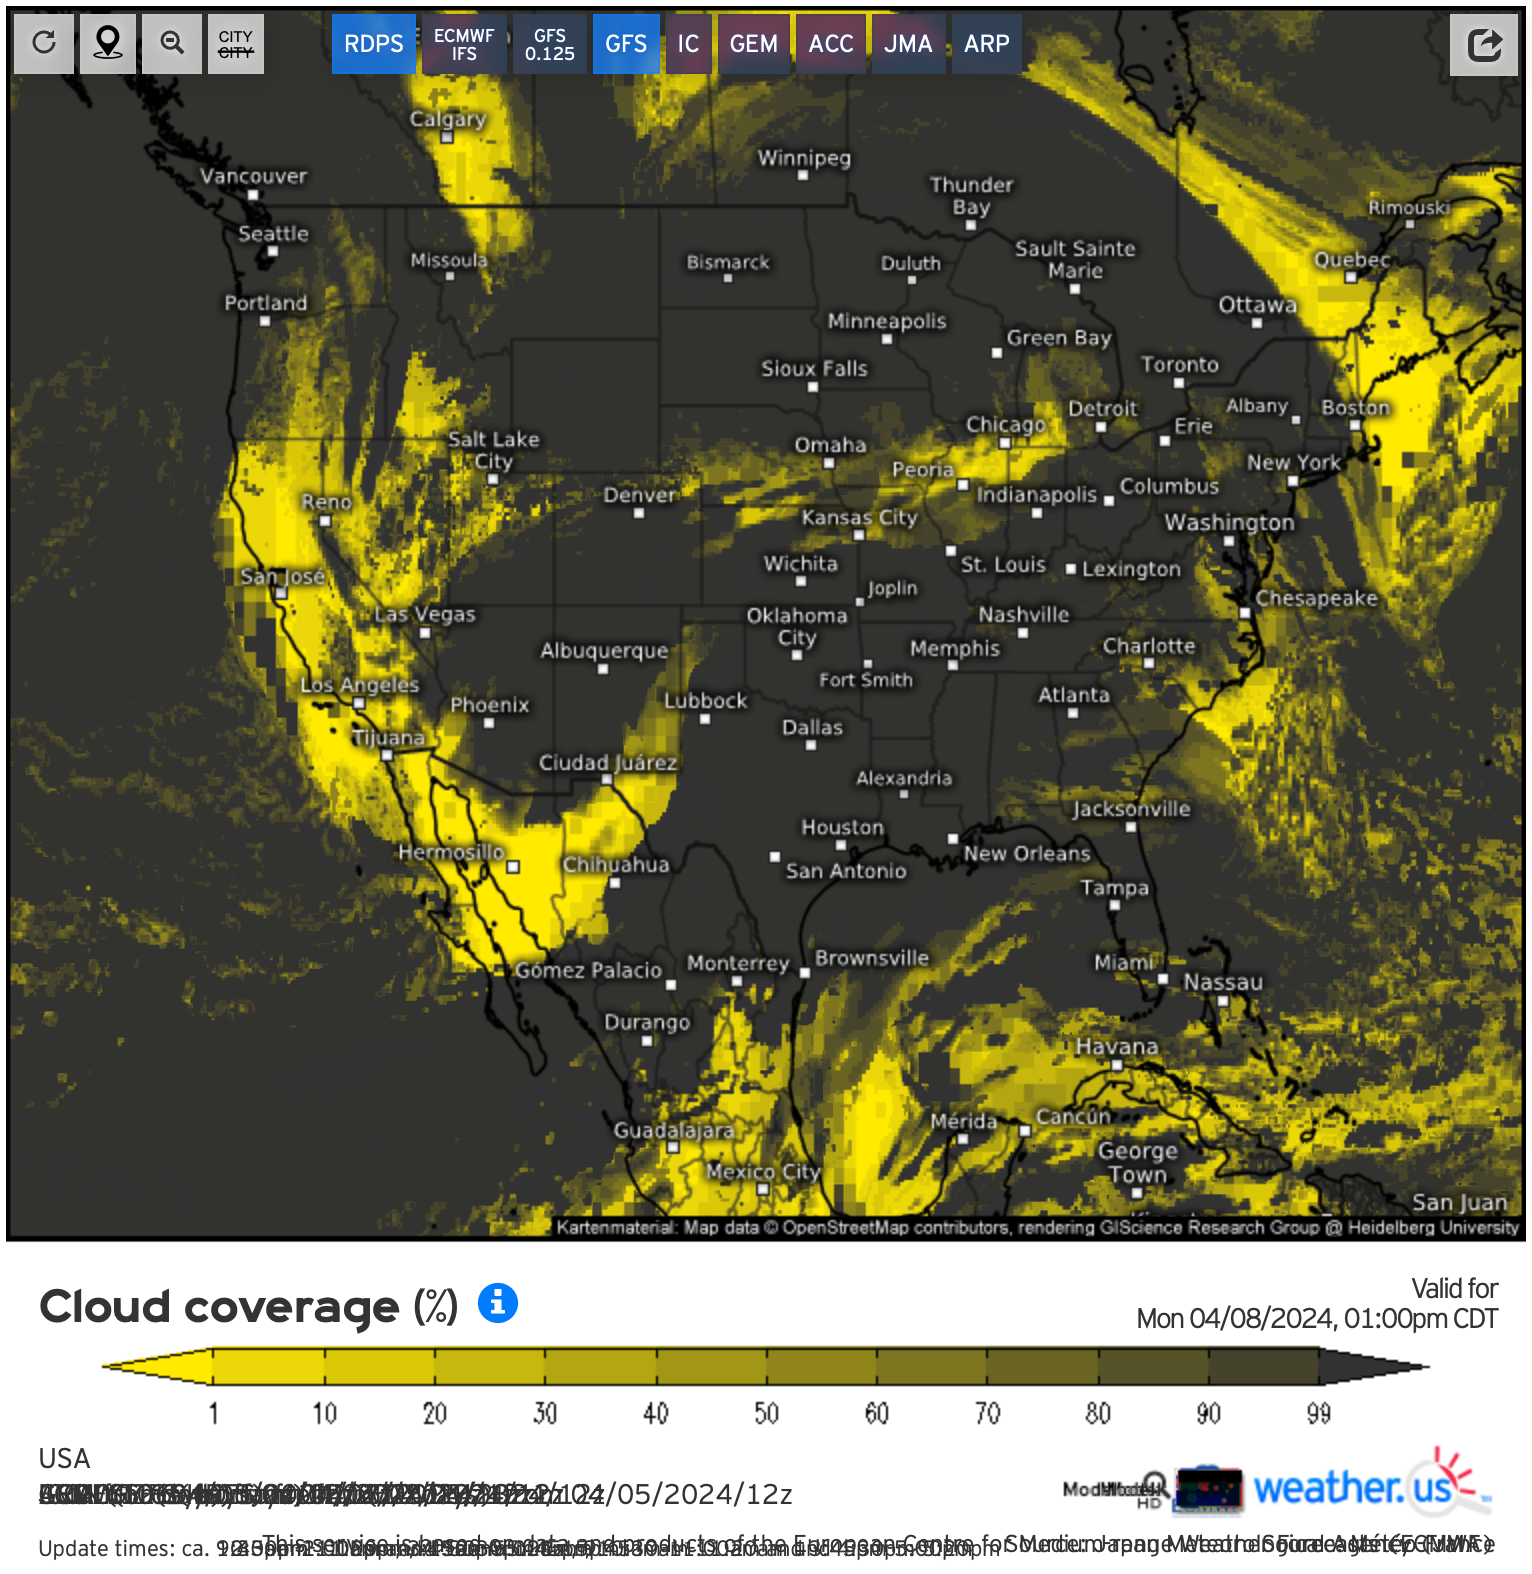
Eclipse Day Minimum

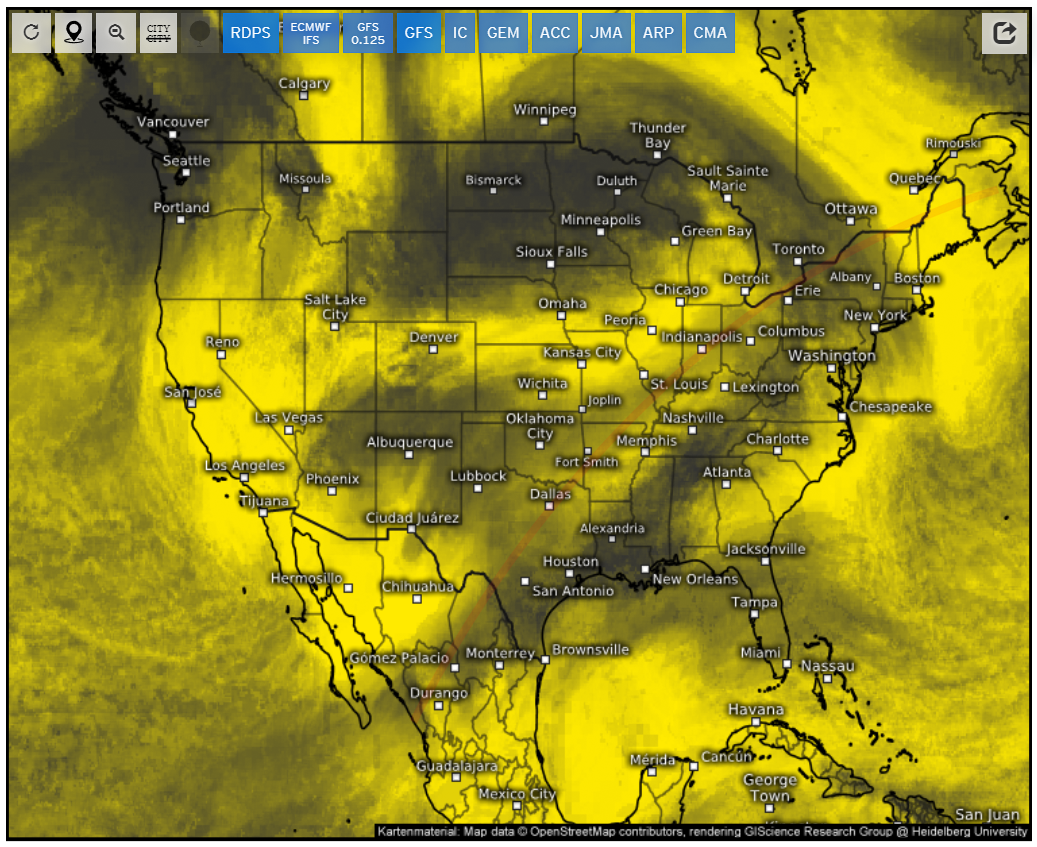
A look at the minimum map (where yellow means no cloud model predicted a cloudy day) shows that Central Arkansas, Southeast Missouri, Quebec, and Maine were the best options this year.
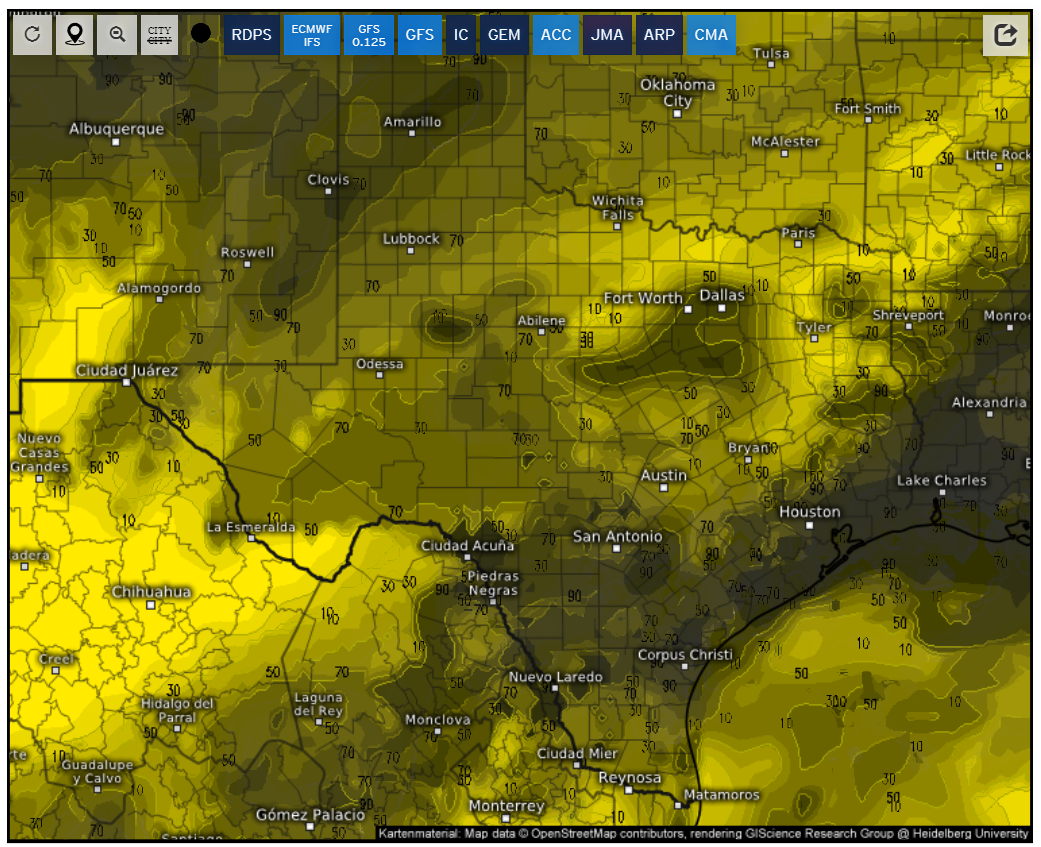
Let’s take one final look at Texas’ weather:
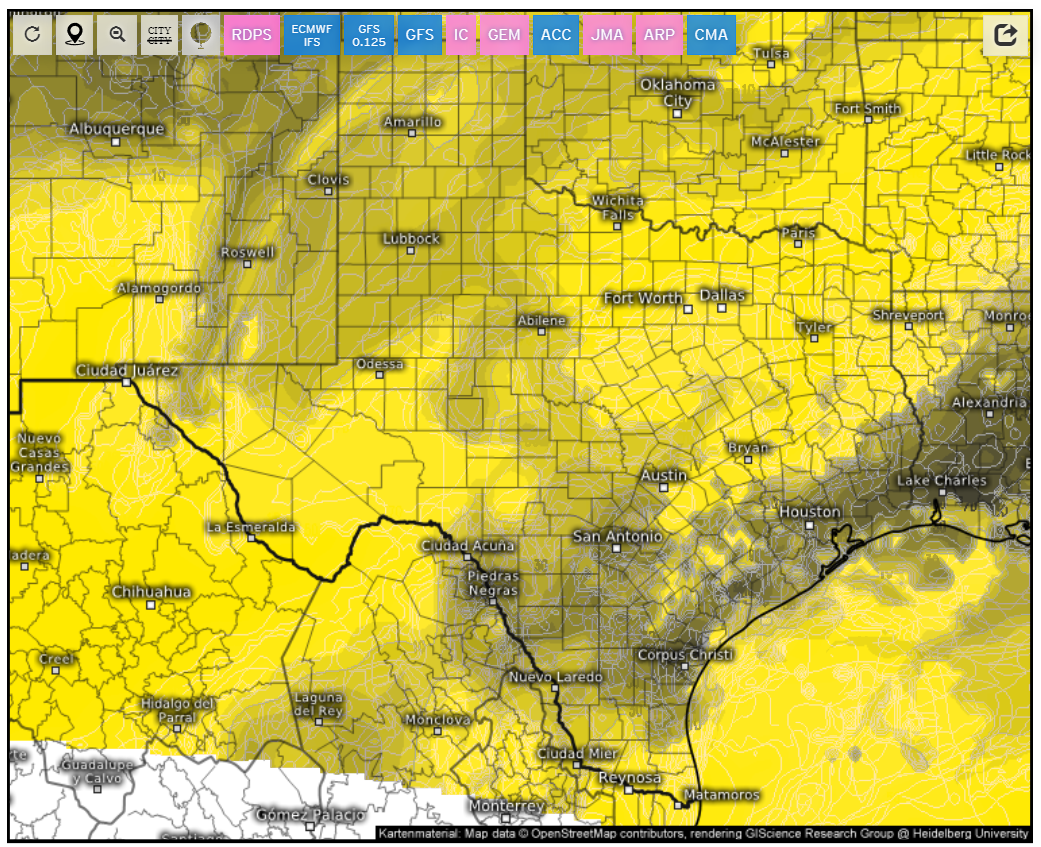
Eclipse Day Mean (Texas)

A pretty significant change happened overnight as a small pocket of comparatively clear skies has opened up just northwest of Austin. Additionally, the forecast for north and west of the Dallas Metro Area has improved, as well.
Eclipse Day Maximum (Texas)

You can really see that new pocket northwest of Austin much clearer on this model.
And that’s where I’ll be heading from San Antonio here in a few minutes! I found a place to park in Burnet at the Hill Country Fellowship, which -at the time of publication- had about 100 extra spots left if you’re looking for a place to go:
https://hcfburnet.churchcenter.com/registrations/events/2137680
Again, it has been a pleasure creating this blog over the last two weeks. Best of luck to everyone today.
Clear skies, friends!
—————
Disclaimers: The information from weather.us included herein is done in a manner consistent with its terms and conditions, which you can read here. H.D. Hunt Photography is a noncommercial website and recognizes the copyright for this material is retained by the originator.
You can support H.D. Hunt Photography through a follow on Instagram:
Comment? Recommendation? Question?
Let us know!
Eclipse Day Cloud Coverage Model at T-24 Hours
After a very cloudy morning in San Antonio, I spent the afternoon walking around the city in sunshine. Let’s hope tomorrow is much the same way.
This is probably going to be my last post of substance on this blog. With the exception of a very uncertain forecast in Texas that we’ll talk more about in a minute, I think the general cloud cover pattern for the day is set. Let’s look at some models:
T-24 Hours Mean
Links to the original content:
https://weather.us/model-charts/euro/usa/total-cloud-coverage/20240408-1800z.html
https://weather.us/model-charts/gfs-hd/usa/total-cloud-coverage/20240408-1800z.html
https://weather.us/model-charts/german/usa/total-cloud-coverage/20240408-1800z.html
https://weather.us/model-charts/can/usa/total-cloud-coverage/20240408-1800z.html
https://weather.us/model-charts/aus/usa/total-cloud-coverage/20240408-1800z.html
https://weather.us/model-charts/jpn/usa/total-cloud-coverage/20240408-1800z.html
https://weather.us/model-charts/french/usa/total-cloud-coverage/20240408-1800z.html
https://weather.us/model-charts/cma/usa/total-cloud-coverage/20240408-1800z.html
https://weather.us/model-charts/can-regional/usa/total-cloud-coverage/20240408-1800z.html
Here it is: your final cloud cover mean map.
As we’ve known for a while, it is going to be a good day in Maine and Quebec. Upstate New York -which was looking great a few days ago- is now likely to have patchy clouds. Ohio, Indiana, Illinois, Missouri, and Arkansas will all require some degree of luck on eclipse day; while you may not be so lucky to have a clear moment during the three-to-four minutes of totality, you will more than likely have a chance to take a look at the partial eclipse.
Mazatlan in Mexico will suffer a similar fate, requiring some degree of luck to see totality.
As mentioned, I’ll unpack Texas’ situation later; but first, here’s the T-24 with the line of totality.
T-24 Mean with Reference Line

You can really see how delicate this forecast is going to be for folks, but the anticipation should make for an exciting day, that’s for sure!
T-24 Hours Maximum

A look at the maximum map (where yellow indicates at least one forecast calling for cloudless skies) reinforces my belief that there’s hope for nearly everyone along the line of totality…
T-24 Hours Minimum
… While the minimum map reinforces my belief that there’s still a high degree of uncertainty in the models overall.
I mentioned earlier Texas is proving to be a special case, yet again, so let’s take a look at it now:
T-24 Mean (Texas)

There is no ideal spot in Texas for eclipse viewing, I am sad to report; furthermore, it appears that -on average- the best spot in Texas for viewing (northwest of Dallas) has a predicted cloud cover of about 40% tomorrow. Not great.
But don’t give up hope yet! There is an incredible amount of uncertainty in the models which are trying to predict how clouds from Mexico will interact with those coming from the Gulf of Mexico. Yes, the whole state could be a total wash; however, if you look at the maximum model for the state, there’s still hope!
T-24 Maximum (Texas)

Eclipses are my Super Bowls and -despite the clouds- I am still super pumped to be able to see one (even if it is obscured somewhat).
If you are curious what I’ll be up to tomorrow, frankly I haven’t decided yet. There’s one final set of data that I can look at which will come out around 2300 hours U.S. Eastern Daylight Time, and this will go a long way in helping me decide where exactly in Texas I’ll be driving.
If I have cell signal where I end up tomorrow, I may do one final pre-eclipse post (without graphics, almost certainly), but if this is the last post you check up on let me wish you the best of luck and I hope you’ve found these posts useful in your decision making!
—————
Disclaimers: The information from weather.us included herein is done in a manner consistent with its terms and conditions, which you can read here. H.D. Hunt Photography is a noncommercial website and recognizes the copyright for this material is retained by the originator.
You can support H.D. Hunt Photography through a follow on Instagram:
Comment? Recommendation? Question?
Let us know!
Eclipse Day Cloud Coverage Model at T-36 Hours
Greetings from a very cloudy San Antonio!
This is going to be a relatively short post because I need to get on with my day; however, there are a couple of updates based on the new information I want to pass along.
First of all, the forecast for Ohio has significantly improved, so take a sigh of relief if you are headed there.
Second, there are pockets around Dallas which some models are viewing quite favorably - we’ll get into that with our Texas breakdown below.
T-36 Hours Mean

Links to the original content:
https://weather.us/model-charts/euro/usa/total-cloud-coverage/20240408-1800z.html
https://weather.us/model-charts/gfs-hd/usa/total-cloud-coverage/20240408-1800z.html
https://weather.us/model-charts/german/usa/total-cloud-coverage/20240408-1800z.html
https://weather.us/model-charts/can/usa/total-cloud-coverage/20240408-1800z.html
https://weather.us/model-charts/aus/usa/total-cloud-coverage/20240408-1800z.html
https://weather.us/model-charts/jpn/usa/total-cloud-coverage/20240408-1800z.html
https://weather.us/model-charts/french/usa/total-cloud-coverage/20240408-1800z.html
https://weather.us/model-charts/cma/usa/total-cloud-coverage/20240408-1800z.html
https://weather.us/model-charts/can-regional/usa/total-cloud-coverage/20240408-1800z.html
Beyond the improvement to Ohio I mentioned earlier, not much has changed between runs which is telling me the forecasts are starting to get locked in.
As stated last post, it looks like Maine and Quebec are going to be the “winners” this go-around.
However…
T-36 Mean with Reference Line
… besides San Antonio (where I am, of course) and Upstate New York there is definitely the option of driving to a clear viewing location along most of the line of totality, which is great news. See the maximum forecast model below (yellow means at least one model is forecasting a clear day).
T-36 Hours Maximum

As per usual, there are still a couple of pessimistic models calling for cloud cover nearly everywhere along the zone of totality, as you can see with the forecasted minimum map (where black indicates where at least one model calls for total cloud cover):
T-36 Hours Minimum

This model remains mostly unchanged besides universal agreement now that parts of Arkansas will have a clear day.
I’ve said it before, I’ll say it again: the key will be flexibility on eclipse day, and you can read how to maximize your chances of success in my how-to guide: How to Choose a Solar Eclipse Viewing Location.
Since many of you are in Texas with me, let’s take a look at the Texas mean forecast:
T-36 Mean (Texas)

Very unfortunately for me, San Antonio is looking like a wash. However, since I follow my own advice and plan for contingencies, I’m still hopeful I will see totality tomorrow.
Where you may ask? Well, there are two pockets which may be favorable: the first is north of Austin (in the Fort Cavazos area), and the second is east of Dallas.
Let’s take a look at the Texas maximum map where you can really see this better:
T-36 Maximum (Texas)
And now the minimum (which I must warn was made without the couple of models which don’t show total cloud cover):
T-36 Minimum (Texas)
Tomorrow is going to be wild and I am looking forward to it!
I am going to issue one more update this evening (probably between 1800 and 1900 U.S. Eastern Daylight Time) and maybe a very quick version in the morning (will depend if I am driving to Dallas or not!)
—————
Disclaimers: The information from weather.us included herein is done in a manner consistent with its terms and conditions, which you can read here. H.D. Hunt Photography is a noncommercial website and recognizes the copyright for this material is retained by the originator.
You can support H.D. Hunt Photography through a follow on Instagram:
Comment? Recommendation? Question?
Let us know!
Eclipse Day Cloud Coverage Model at T-60 Hours
One last update before I head out to San Antonio!
Overall, the models have begun to agree much more for most (but not all!) of the zone of totality as the line of clouds is a lot more well defined on the mean stack compared to past runs.
It looks like if you rolled the dice and chose to head to Maine, you’re going to be the “winner” of this eclipse.
But don’t fret, there’s still plenty of opportunity across the zone of totality.
Aaand! Texas is starting to look a bit friendlier. More on that in a bit!
T-60 Hours Mean

Links to the original content:
https://weather.us/model-charts/euro/usa/total-cloud-coverage/20240408-1800z.html
https://weather.us/model-charts/gfs-hd/usa/total-cloud-coverage/20240408-1800z.html
https://weather.us/model-charts/german/usa/total-cloud-coverage/20240408-1800z.html
https://weather.us/model-charts/can/usa/total-cloud-coverage/20240408-1800z.html
https://weather.us/model-charts/aus/usa/total-cloud-coverage/20240408-1800z.html
https://weather.us/model-charts/jpn/usa/total-cloud-coverage/20240408-1800z.html
https://weather.us/model-charts/french/usa/total-cloud-coverage/20240408-1800z.html
https://weather.us/model-charts/cma/usa/total-cloud-coverage/20240408-1800z.html
https://weather.us/model-charts/can-regional/usa/total-cloud-coverage/20240408-1800z.html
Unfortunately, with the eastward push of the line of clouds, those headed to Northeast Ohio and Western New York are potentially in for a cloud afternoon.
Here’s the model above with an approximation of the eclipse centerline.
T-60 Mean with Reference Line
The eastward drift of the cloud line really becomes apparent when you look at the maximum forecast (bright yellow indicating areas where at least one model calls for clear skies):
T-60 Hours Maximum

That said, there’s still some disagreement with the forecasted minimum map (where black indicates where at least one model calls for total cloud cover):
T-60 Hours Minimum with Reference Line

As you can see, the only slam-dunk area to see totality is going to be Maine and Quebec.
Don’t fret, however, if you are anywhere else along the line of totality as you still have a chance of seeing a fully eclipsed sun.
The key will be flexibility on eclipse day, and you can read how to maximize your chances of success in my how-to guide: How to Choose a Solar Eclipse Viewing Location.
Probably the most profound development in the last few hours has been the improvement with the forecast in parts of Texas. I know many of you have been sweating this, so I’ll dig into this a bit deeper:
T-60 Mean (Texas)

We have witnessed a significant improvement in the forecast in the Dallas Metro Area over the last 24 hours. Even areas west of San Antonio have had their chances increased.
It is important to remember: Texas remains -by far- the region where cloud uncertainty is greatest. All the same, it is great to see more models predicting some cloudless parts of the state:
T-60 Maximum (Texas)

Hang in there!
P.S. - I’m not sure when my next post is going to be given my travel to Texas, but I suspect I’ll be able to sneak in a few more posts between now and Monday morning … since I’ll be on a laptop, fair warning they may not be as detailed as these ones have been.
—————
Disclaimers: The information from weather.us included herein is done in a manner consistent with its terms and conditions, which you can read here. H.D. Hunt Photography is a noncommercial website and recognizes the copyright for this material is retained by the originator.
You can support H.D. Hunt Photography through a follow on Instagram:
Comment? Recommendation? Question?
Let us know!
Eclipse Day Cloud Coverage Model at T-78 Hours
We’re getting close now! But not close enough that the models concur, unfortunately. As it has been for the last few runs now, the forecast is indicating a line of clouds traveling through the zone of totality near the time of totality. Where this line of clouds will be during totality remains inconsistent, although I think the models have generally trended this line eastward. Here’s the most recent mean of the available cloud forecasts:
T-78 Hours Mean
Links to the original content:
https://weather.us/model-charts/euro/usa/total-cloud-coverage/20240408-1800z.html
https://weather.us/model-charts/gfs-hd/usa/total-cloud-coverage/20240408-1800z.html
https://weather.us/model-charts/german/usa/total-cloud-coverage/20240408-1800z.html
https://weather.us/model-charts/can/usa/total-cloud-coverage/20240408-1800z.html
https://weather.us/model-charts/aus/usa/total-cloud-coverage/20240408-1800z.html
https://weather.us/model-charts/jpn/usa/total-cloud-coverage/20240408-1800z.html
https://weather.us/model-charts/french/usa/total-cloud-coverage/20240408-1800z.html
https://weather.us/model-charts/cma/usa/total-cloud-coverage/20240408-1800z.html
And now let’s compare this with the model from T-222.
T-222 Hours Mean

You can see this eastward push that I am referring to.
This favors parts of Ohio, Indiana, Illinois, Missouri, and certainly Arkansas, while coming at the expense of parts of Upstate New York.
Here’s the T-78 hours model with an approximation of the line of totality for reference:
T-78 Mean with Reference Line

But, like I said, there’s still a ton of variation in the models. Let’s look at the T-78 maximum first (bright yellow indicating areas where at least one model calls for clear skies):
T-78 Hours Maximum

And compare this to the T-78 minimum (where black indicates where at least one model calls for total cloud cover):
My instinct is telling me that while the next 24 hours will push the models to a point similar to how they will appear at T-6, there is still going to be a significant amount of chaotic uncertainty. While you won’t be able to do much about the region you’ll be traveling to, you will be well-served to come up with multiple contingency locations for viewing in the region in which you are traveling and monitor the cloud cover up until the morning of the eclipse.
Find some tips and tricks on how to do this in my how-to guide: How to Choose a Solar Eclipse Viewing Location.
Gird up - it’s going to be a wild ride!
—————
Disclaimers: The information from weather.us included herein is done in a manner consistent with its terms and conditions, which you can read here. H.D. Hunt Photography is a noncommercial website and recognizes the copyright for this material is retained by the originator.
You can support H.D. Hunt Photography through a follow on Instagram:
Comment? Recommendation? Question?
Let us know!
Eclipse Day Cloud Coverage Model at T-84/90/96 Hours
We’re now officially inside the 96-hour window where cloud models become more reliable. The forecasts are beginning to concur, so let’s take a look at what our merged eight model forecast has in store.
T-84/90-96 Hours Mean
Links to the original content:
https://weather.us/model-charts/euro/usa/total-cloud-coverage/20240408-1800z.html
https://weather.us/model-charts/gfs-hd/usa/total-cloud-coverage/20240408-1800z.html
https://weather.us/model-charts/german/usa/total-cloud-coverage/20240408-1800z.html
https://weather.us/model-charts/can/usa/total-cloud-coverage/20240408-1800z.html
https://weather.us/model-charts/aus/usa/total-cloud-coverage/20240408-1800z.html
https://weather.us/model-charts/jpn/usa/total-cloud-coverage/20240408-1800z.html
https://weather.us/model-charts/french/usa/total-cloud-coverage/20240408-1800z.html
https://weather.us/model-charts/cma/usa/total-cloud-coverage/20240408-1800z.html
Generally speaking, the models are calling for a relatively clear day in Maine, Quebec, Vermont and the Adirondacks Region of Upstate New York. From Western New York through Northeast Ohio is a higher chance of cloud cover, as in Dallas, San Antonio, and Mazatlan. The areas along the range of totality between Arkansas and Central Ohio do not concur amongst the models, indicating the potential for clouds during totality.
T-84/90/96 Hours Minimum

Looking at the model stack’s minimum render, the only areas the models agree will be cloud-free are Northern Vermont, those parts of Quebec, and parts of Maine. Nearly every other location along the path of totality has at least one model calling for clouds.
T-84/90/96 Hours Maximum

Conversely, nearly every city along the path of totality has a model which shows a cloud-free day (the main exception being areas around San Antonio.)
So what does all this mean? Well, my take is pretty simple: there is still a high degree of uncertainty between the models at this point in time and almost every location along the path of totality has at least a chance of 3 minutes of cloudiness during totality. Some areas (Maine, Quebec) have a higher chance than others (Southern Texas), but I don’t think there’s any need to make a snap decisions about changing locations at the moment. And to put my money where my mouth is: I’m still going to be heading to San Antonio.
—————
Disclaimers: The information from weather.us included herein is done in a manner consistent with its terms and conditions, which you can read here. H.D. Hunt Photography is a noncommercial website and recognizes the copyright for this material is retained by the originator.
You can support H.D. Hunt Photography through a follow on Instagram:
Comment? Recommendation? Question?
Let us know!
Eclipse Day Cloud Coverage Model at T-150 Hours
We’re back! Even I have to work sometimes, but -good news!- there still isn’t any real consensus about the forecast to share.
Here we go:
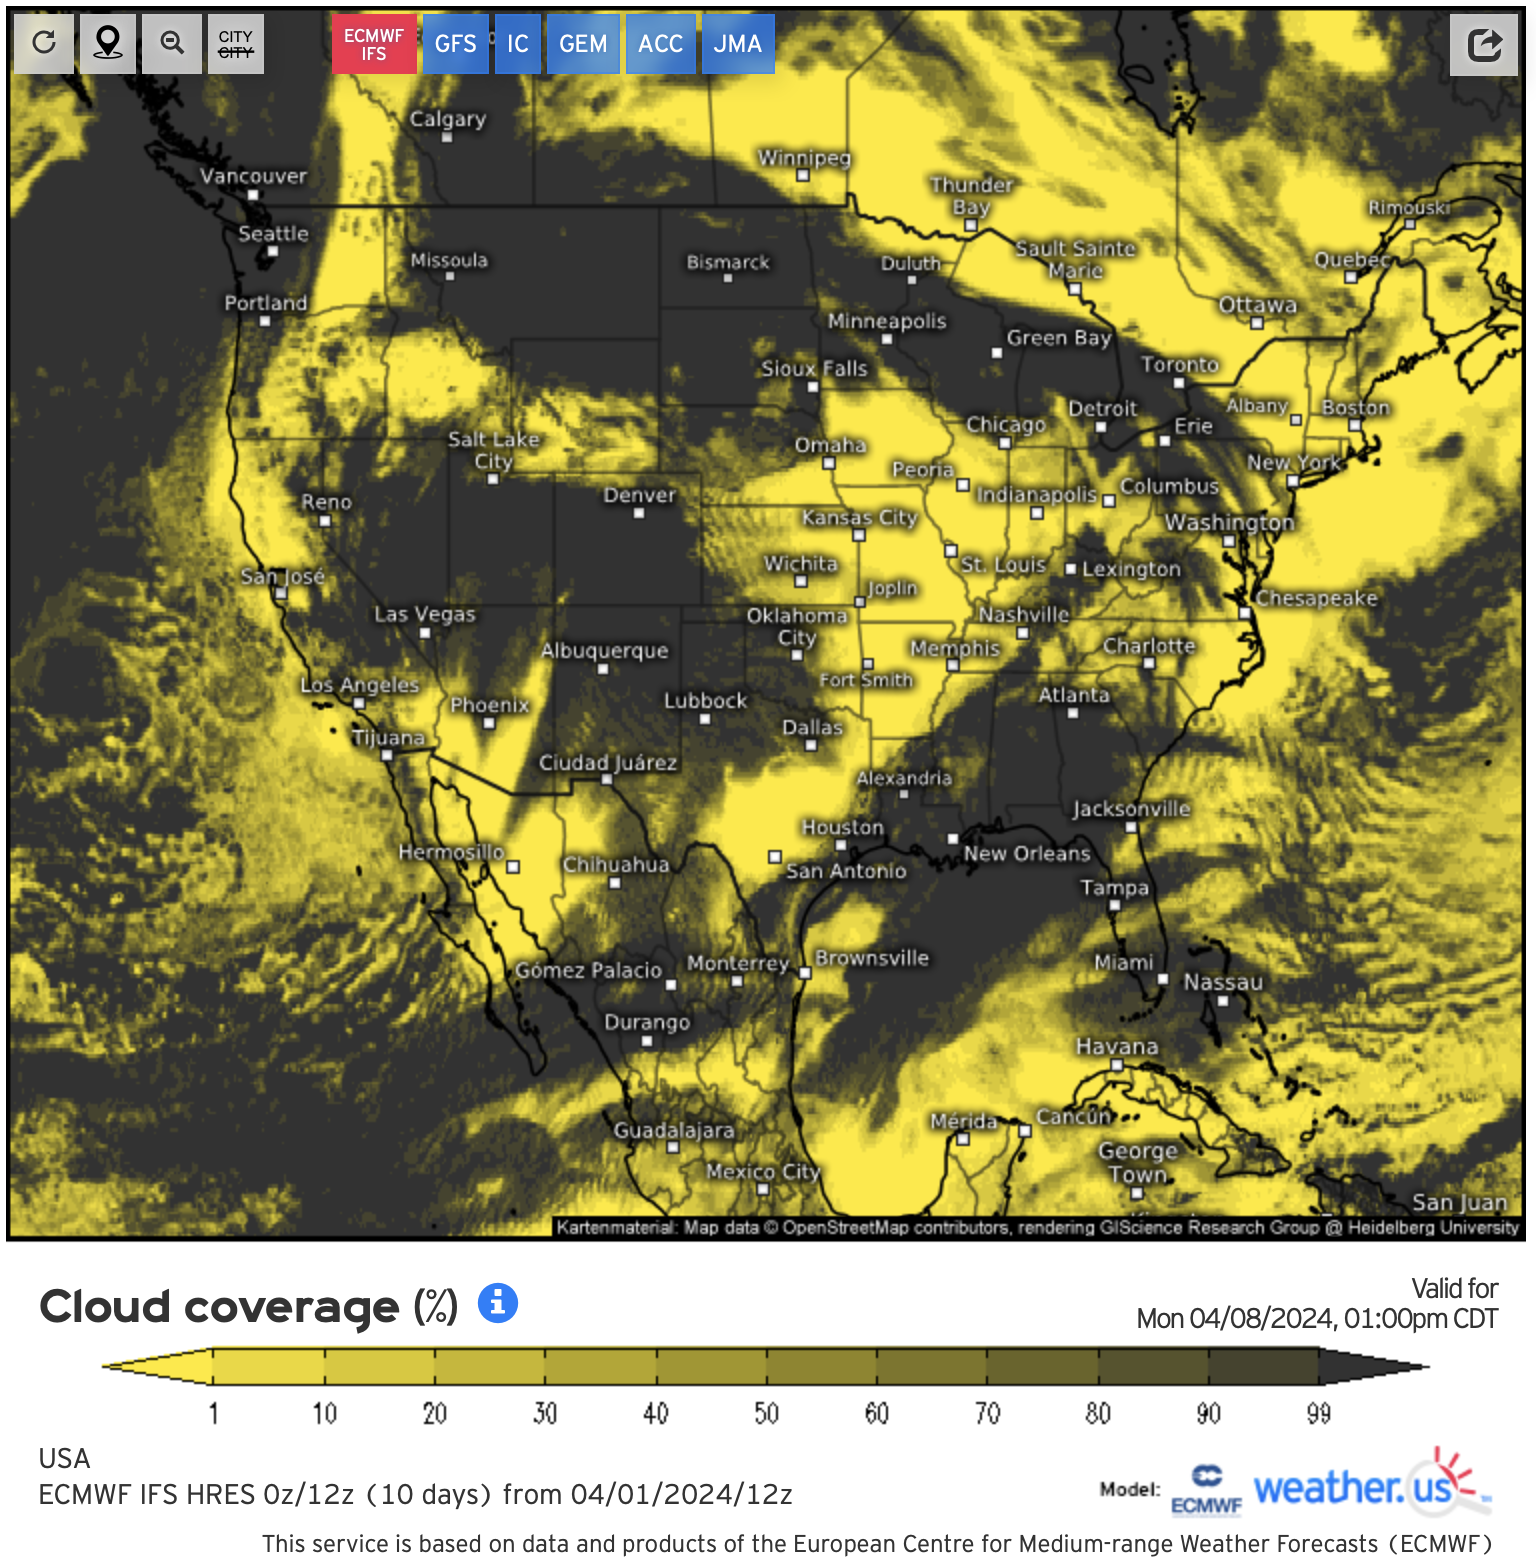
European Centre for Medium-Range Weather Forecasts

Link to the original content: https://weather.us/model-charts/euro/usa/total-cloud-coverage/20240408-1800z.html
Well, compared to yesterday’s forecast, Texas, Arkansas, and Upstate New York’s forecasts were downgraded. Most everything else remains the same.
Global Forecast System
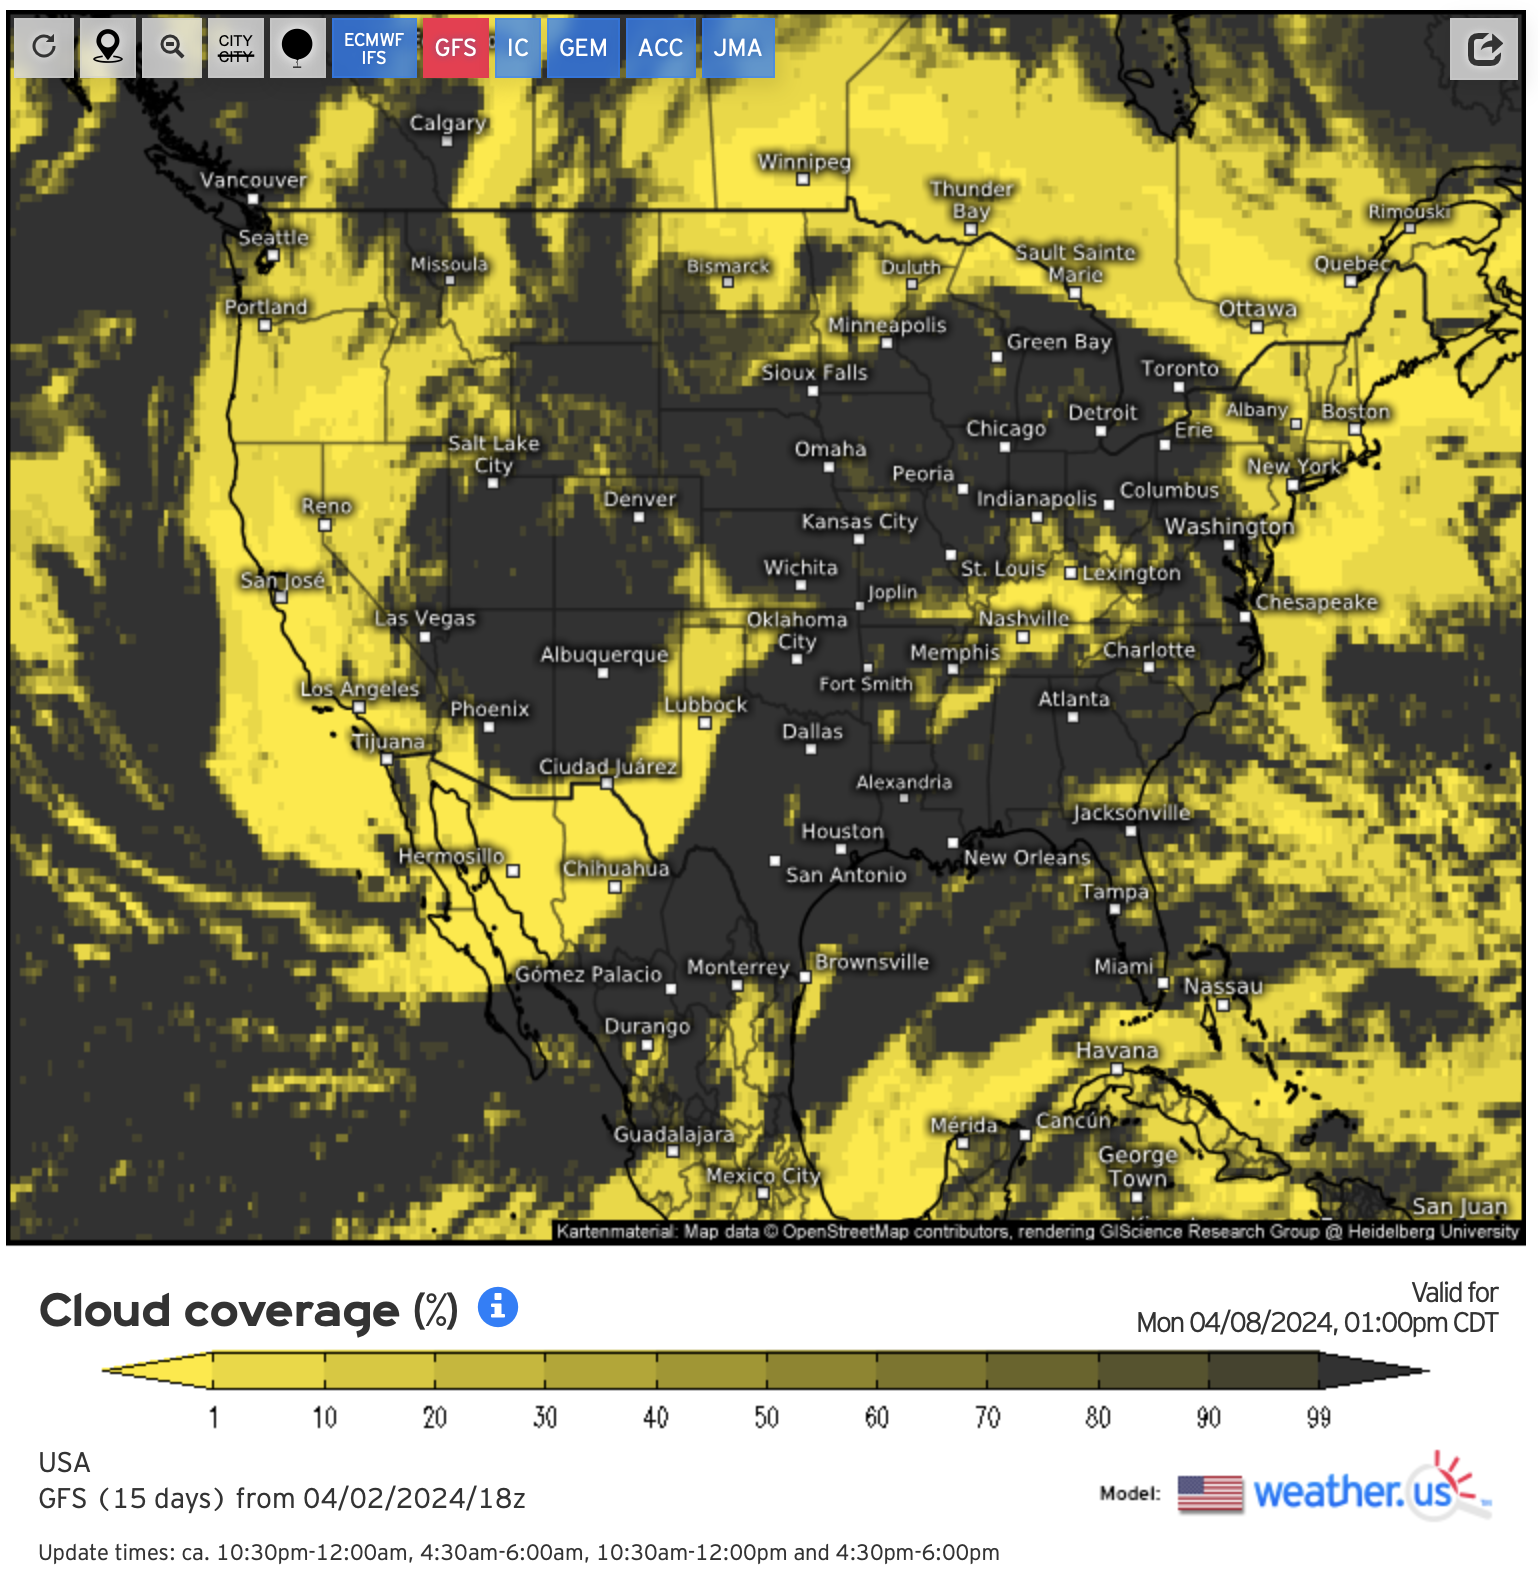
Link to the original content: https://weather.us/model-charts/standard/usa/total-cloud-coverage/20240408-1800z.html
The GFS also remains mostly unchanged, with a small downgrade in parts of Upstate New York while Southern Indiana is marginally improving.
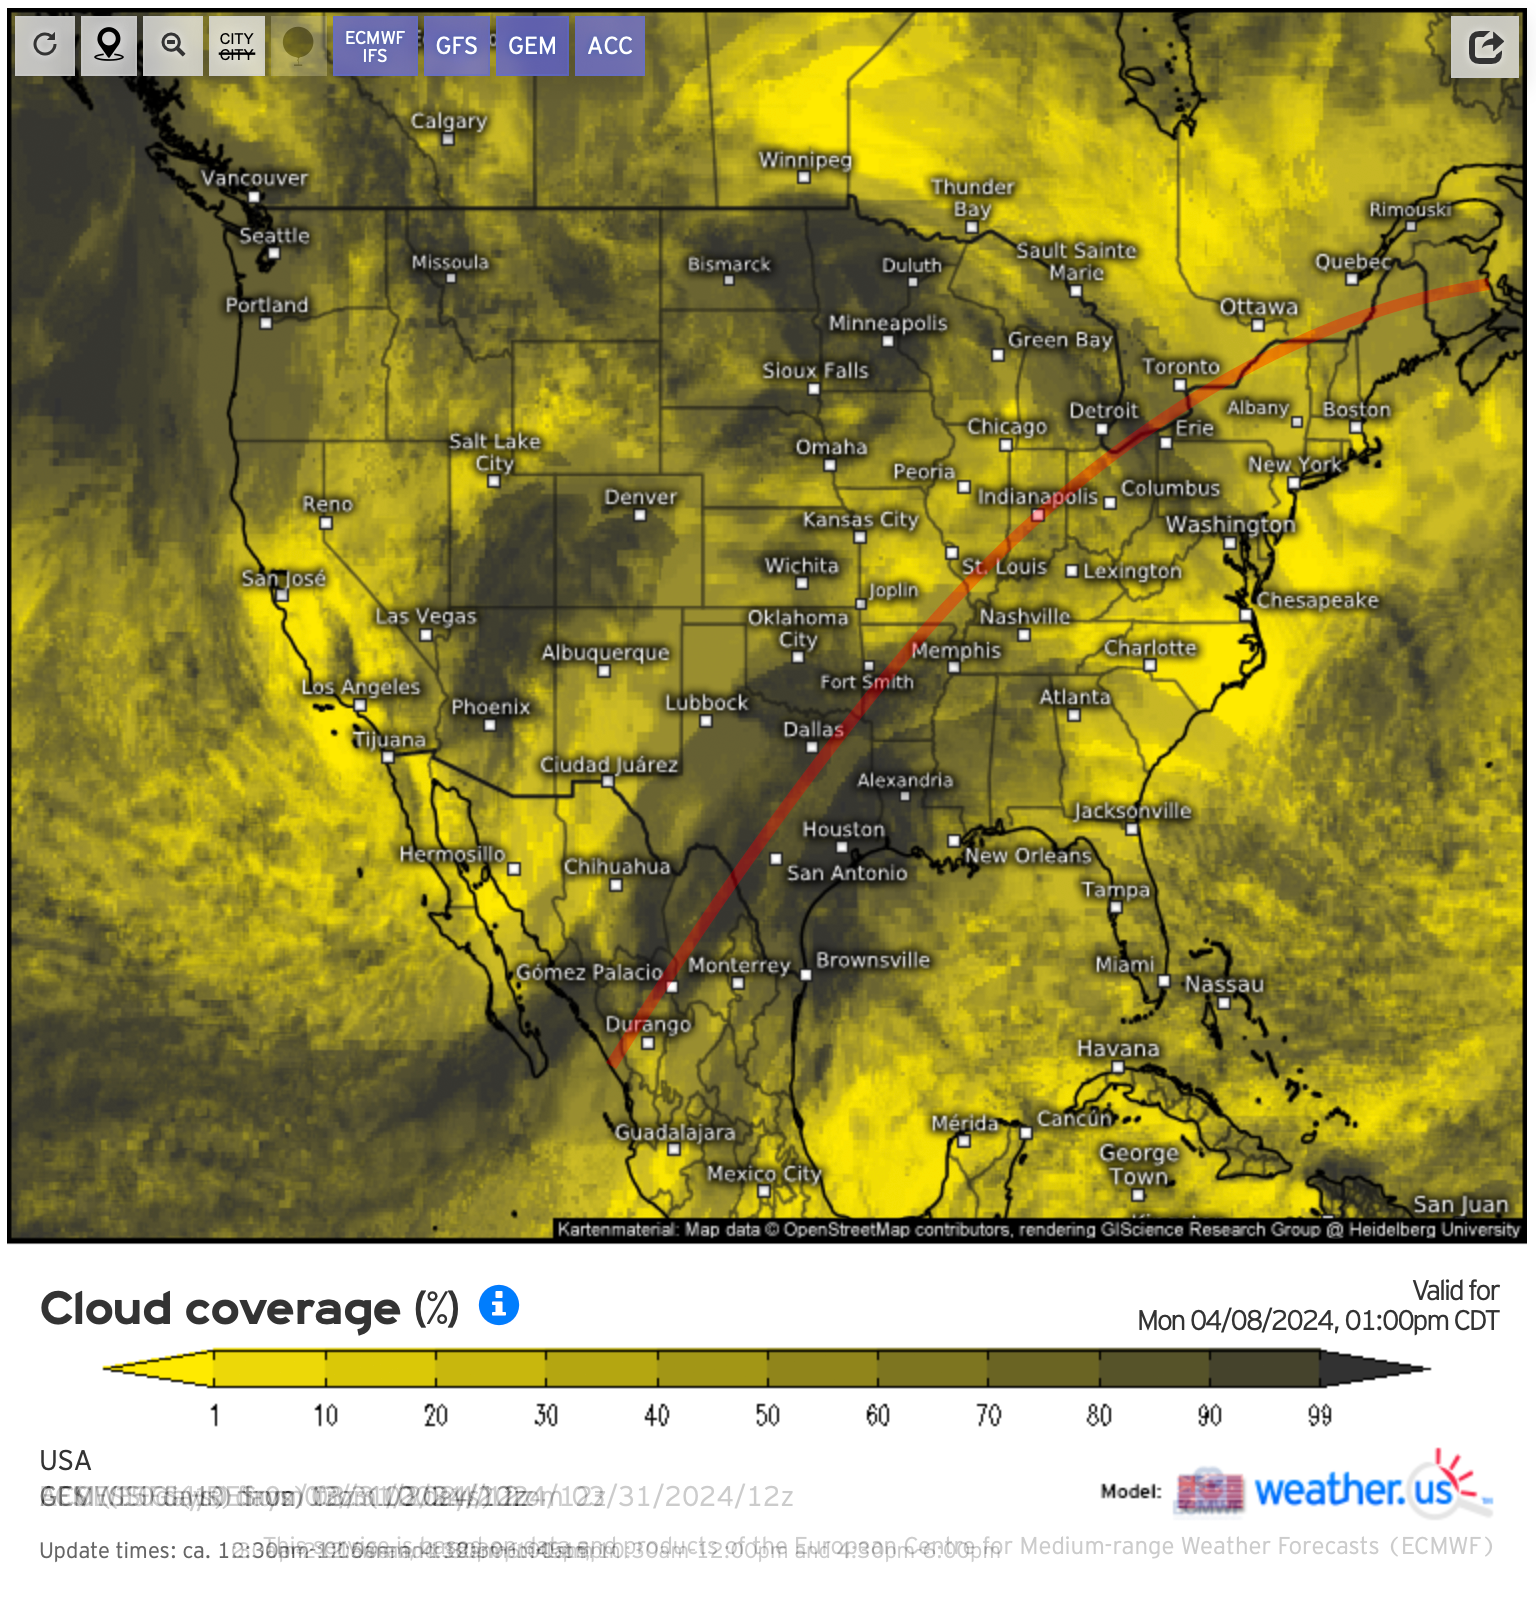
Global Environmental Multi-Scale Model

Link to the original content: https://weather.us/model-charts/can/usa/total-cloud-coverage/20240408-1800z.html
GEM has doubled-down on the concept of a front moving to the east of the MIMAL states during totality, with Ohio and Indiana’s forecasts significantly downgraded.
Australian Community Climate and Earth-System Simulator

Link to the original content: https://weather.us/model-charts/aus/usa/total-cloud-coverage/20240408-1800z.html
ACCESS improved its outlook for parts of Ohio and Indiana, although it still calls for patchy clouds. Texas’ forecast has taken a step backwards, while Mazatlan now looks like a total mess.
Japan Meteorological Agency
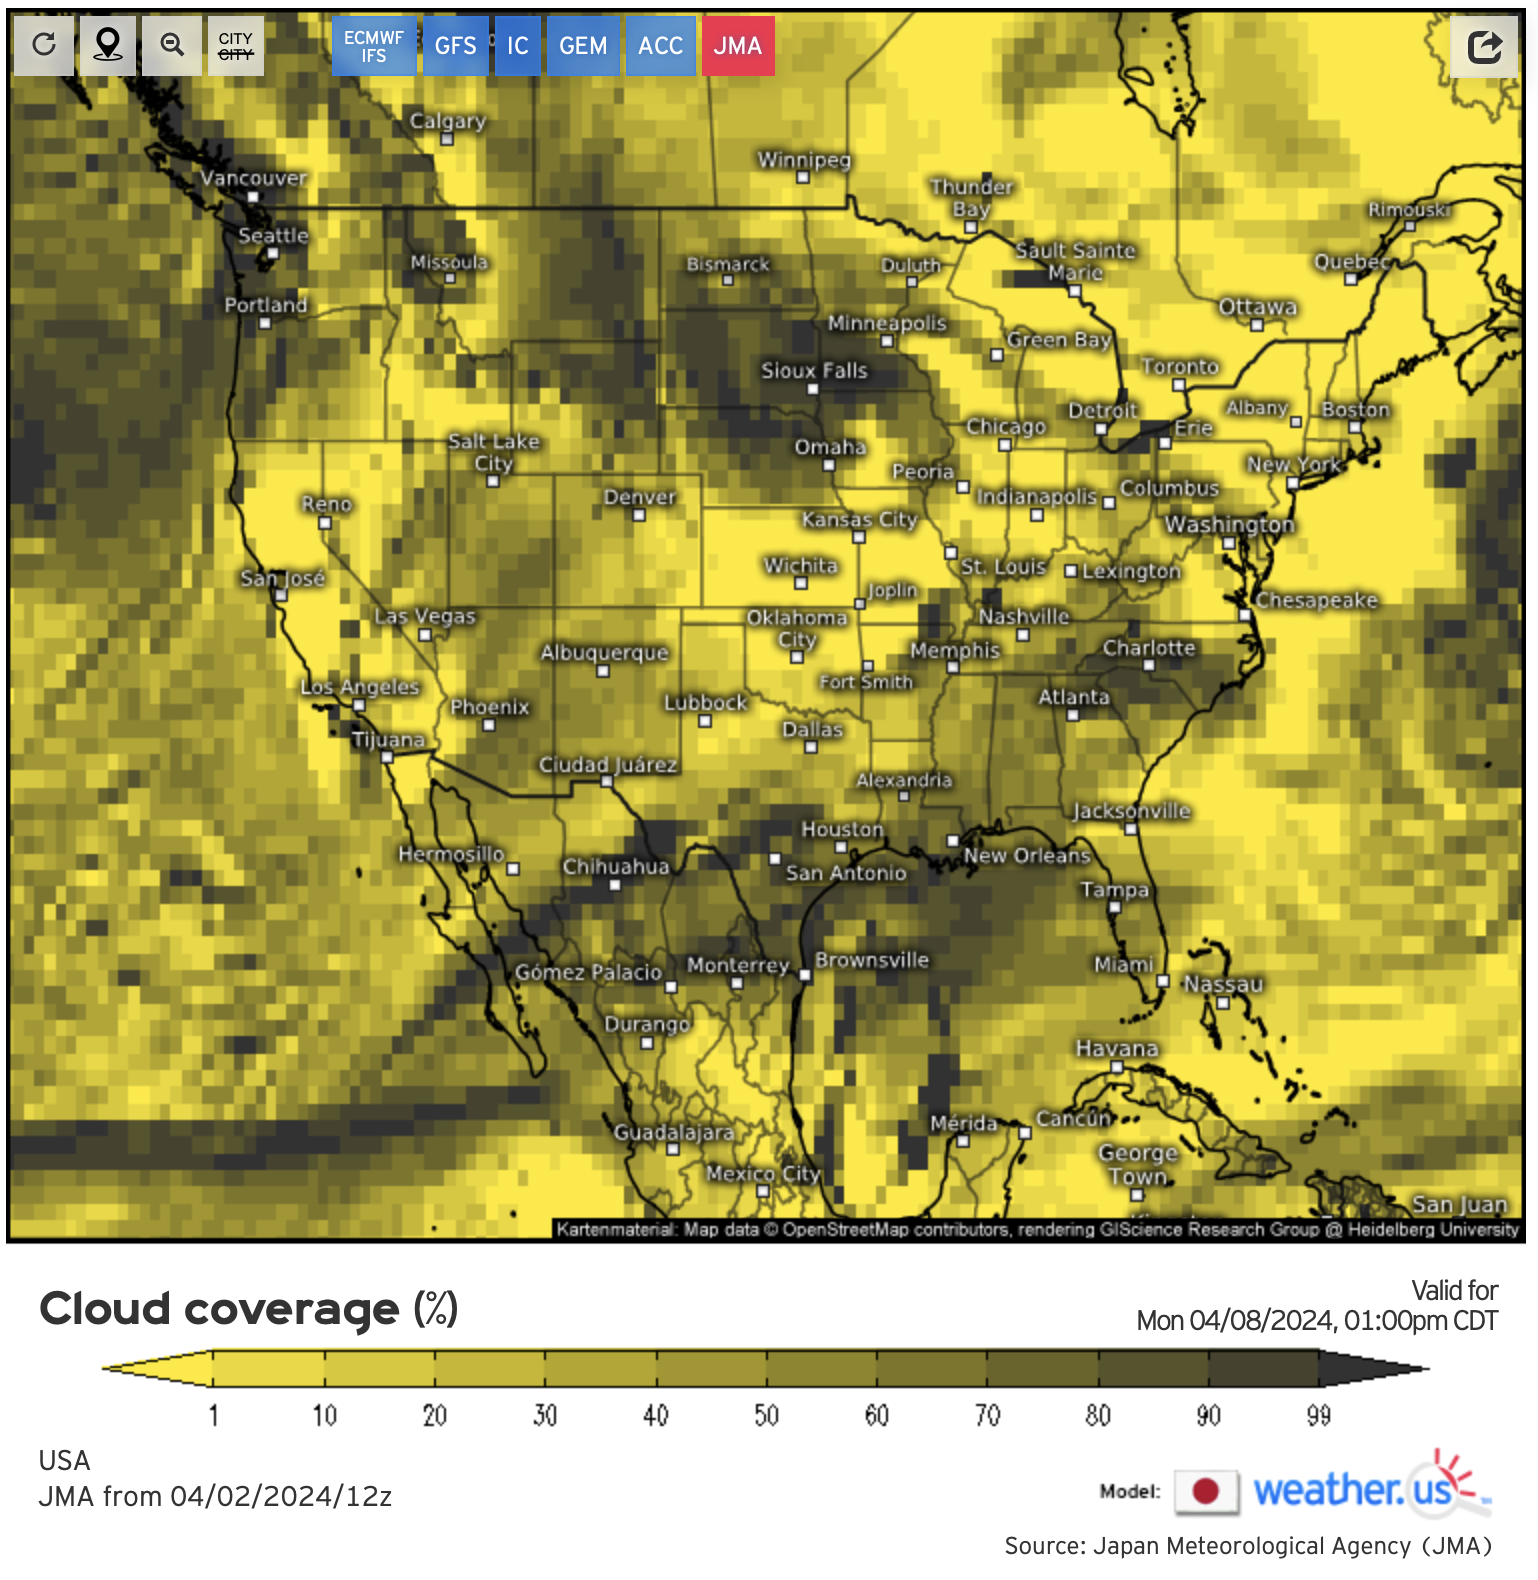
Link to the original content: https://weather.us/model-charts/jpn/usa/total-cloud-coverage/20240408-1800z.html
The JMA is eerily similar run-to-run, with it also pushing the front east of the MIMAL states.
Icosahedral Nonhydrostatic

Link to the original content: https://weather.us/model-charts/german/usa/total-cloud-coverage/20240408-1800z.html
As with other forecasts, ICON has the front moving further east … but also more south than the others. Texas’ outlook as been downgraded slightly while Central Arkansas is a wash.
T-150 Mean Cloud Forecast and Implications

The mean is still a grey mess, with the only major differences overall being an improvement of Southern Illinois’ collective outlook, while Upstate New York’s has taken a small downgrade.
I think the key takeaway from this run is that models are getting more consistent with themselves as time goes on … but not with each other. This suggests there is still a high degree of uncertainty in the models, so I still recommend holding off on making rash travel change decisions.
The “upside”? Even if you wanted to change locations, there aren’t too many options which are seen as cloudless on all six models:

T-150 Clear Cloud Forecast with Path of Totality

A small change, I am going to be posting the cloudless map with the path of totality moving forward..
I’ll be following up intermittently, so stay tuned for more!
—————
Disclaimers: The information from weather.us included herein is done in a manner consistent with its terms and conditions, which you can read here. H.D. Hunt Photography is a noncommercial website and recognizes the copyright for this material is retained by the originator.
You can support H.D. Hunt Photography through a follow on Instagram:
Comment? Recommendation? Question?
Let us know!
Eclipse Day Cloud Coverage Model at T-174 Hours
So you’re saying there’s a chance!
This afternoon’s models are the most interesting collection yet and may give hope to some of you who had given up on seeing totality. We also add a sixth model to the mix, the appropriately formal-sounding German Icosahedral Nonhydrostatic forecast, or ICON for short.
Let’s get into it:
European Centre for Medium-Range Weather Forecasts
Link to the original content: https://weather.us/model-charts/euro/usa/total-cloud-coverage/20240408-1800z.html
It’s a miracle - for the first time, the ECMWF has relatively clear skies across Central Texas and Arkansas. Southern Illinois and Indiana’s forecasts have improved, while Northeast Ohio and the Buffalo Region are as uncertain as they were on the last model. Upstate New York and New England’s forecasts remain generally unchanged.
Global Forecast System

Link to the original content: https://weather.us/model-charts/standard/usa/total-cloud-coverage/20240408-1800z.html
In stark contrast, the GFS has downgraded nearly every region of totality besides Upstate New York and parts of New England to total cloud cover. This, to me, is the model to watch as its forecast has remained mostly unchanged since T-222.
Global Environmental Multi-Scale Model

Link to the original content: https://weather.us/model-charts/can/usa/total-cloud-coverage/20240408-1800z.html
In the first case of strong correlation since I started looking at these models at T-222, the GFS and the ECMWF are pretty darn close together on this one. This is good news for Texas and Arkansas, not so great news for Niagara Falls.
Australian Community Climate and Earth-System Simulator

Link to the original content: https://weather.us/model-charts/aus/usa/total-cloud-coverage/20240408-1800z.html
ACCESS didn’t change much between runs, although it is worth noting their forecast for Southern Missouri, Northern Arkansas, and the area south of Dallas has been downgraded, as has spots in Upstate New York and Maine.
Japan Meteorological Agency

Link to the original content: https://weather.us/model-charts/jpn/usa/total-cloud-coverage/20240408-1800z.html
The JMA didn’t change much between runs, with only slight improvements east of Dallas and in Northern Arkansas being noted.
Icosahedral Nonhydrostatic

Link to the original content: https://weather.us/model-charts/german/usa/total-cloud-coverage/20240408-1800z.html
ICON -a cloud model which only runs inside of seven days- is now available and, wow, this is a different perspective than we’ve gotten used to, eh? Looking forward to comparing this model in the future!
T-174 Mean Cloud Forecast and Implications

Well, this is pretty chaotic, isn’t it? Besides the Adirondacks and Vermont, there really isn’t anywhere these models seem to agree on. As I mentioned, this uncertainty is primarily the result of the models having varying opinions as to when a front will move through the Midwest.
I know I keep saying the forecast is in flux and that patience is necessary, but to show you just how wild these models are, here is the pixel maximum from the six models:

Awesome! 8 April is going to be an awesome day!
Not so fast - here’s the minimum:

Hang in there! We should hopefully have some more model agreement soon!
T-174 Mean Cloud Forecast with Path of Totality

For quick reference, here is an approximate path of totality overlaid on the cloud coverage map.
I’ll be following up intermittently, so stay tuned for more!
—————
Disclaimers: The information from weather.us included herein is done in a manner consistent with its terms and conditions, which you can read here. H.D. Hunt Photography is a noncommercial website and recognizes the copyright for this material is retained by the originator.
You can support H.D. Hunt Photography through a follow on Instagram:
Comment? Recommendation? Question?
Let us know!
Eclipse Day Cloud Coverage Model at T-186 Hours
At T-186, the overall forecast has improved somewhat for Northern Texas but downgraded for Central Ohio.
As usual, we will start our model breakdown with the European Centre for Medium-Range Weather Forecasts Model:
European Centre for Medium-Range Weather Forecasts

Link to the original content: https://weather.us/model-charts/euro/usa/total-cloud-coverage/20240408-1800z.html
The ECMWF is showing glimmers of hope for parts of Texas, although it has slightly downgraded its forecast for Arkansas as a result. Most of the rest of the band remains unchanged, with extreme pessimism continuing for Mazatlan.
Global Forecast System

Link to the original content: https://weather.us/model-charts/standard/usa/total-cloud-coverage/20240408-1800z.html
The main changes in the GFS from last report include a downgraded outlook for Indiana, Ohio, with upgraded prospects for Upstate New York and New England. Arkansas, Texas, and Mazatlan are still not looking great.
Global Environmental Multi-Scale Model

Link to the original content: https://weather.us/model-charts/can/usa/total-cloud-coverage/20240408-1800z.html
The GEM has showed upgraded forecasts pretty much across the whole area of totality with perhaps the exception of Maine, which is slightly cloudier than last report. Texas, Arkansas, and Ohio still have patchy clouds scheduled.
Australian Community Climate and Earth-System Simulator

Link to the original content: https://weather.us/model-charts/aus/usa/total-cloud-coverage/20240408-1800z.html
ACCESS had the most significant change amongst the models from last report, showing a well-developed front pushing through the Midwest and into Upstate New York turning the skies from Illinois to west of the Adirondacks dark. It also has significantly upgraded its forecast for Northern Texas and Arkansas, while holding its forecast for Missouri.
Japan Meteorological Agency

Link to the original content: https://weather.us/model-charts/jpn/usa/total-cloud-coverage/20240408-1800z.html
It has been a minute since we looked at the JMA forecast, but this most recent run’s forecast remains unchanged for all points north of Missouri. Arkansas’ prospects look better, whilst Central Texas’ have diminished slightly.
T-186 Mean Cloud Forecast and Implications

The biggest difference over the last 12 hours is the slight improvements in the forecast for North Texas and Arkansas, whose prospects don’t look entirely bleak any longer. Mazatlan’s prospects have improved, as well. There is less consensus in Northeast Ohio than there once was. Southern Illinois and Upstate New York remain the safest bets.
The key factor here remains the front which will move through the area of totality around eclipse day. There is little agreement as to which path this front will take, and the next 48 hours will be very telling.
I’d still be hesitant to make any rash travel decisions given the unpredictable nature of this weather system.
T-186 Mean Cloud Forecast with Path of Totality

For quick reference, here is an approximate path of totality overlaid on the cloud coverage map.
I’ll be following up intermittently, so stay tuned for more!
—————
Disclaimers: The information from weather.us included herein is done in a manner consistent with its terms and conditions, which you can read here. H.D. Hunt Photography is a noncommercial website and recognizes the copyright for this material is retained by the originator.
You can support H.D. Hunt Photography through a follow on Instagram:
Comment? Recommendation? Question?
Let us know!
Eclipse Day Cloud Coverage Model at T-198 Hours
At T-198, things are still looking not great for Texas but improving, while a few models have the forecast in Southern Illinois, Southern Indiana, and Ohio looking clearer.
As usual, we will look at each available model, starting with the European Centre for Medium-Range Weather Forecasts Model:
European Centre for Medium-Range Weather Forecasts

Link to the original content: https://weather.us/model-charts/euro/usa/total-cloud-coverage/20240408-1800z.html
The ECMWF forecast has improved for the Ohio River Valley; however, it is still very pessimistic about Texas’ prospects for a clear day.
Global Forecast System

Link to the original content: https://weather.us/model-charts/standard/usa/total-cloud-coverage/20240408-1800z.html
Similarly, the GFS model is more optimistic than it has been for Southern Illinois; it is more bearish for a clear day in Upstate New York and New England than it has been, however. Texas and Mazatlan are also given bleak outlooks.
Global Environmental Multi-Scale Model

Link to the original content: https://weather.us/model-charts/can/usa/total-cloud-coverage/20240408-1800z.html
The traditionally optimistic GEM model has lost its enthusiasm for a clear day in most of Ohio, parts of Upstate New York, and Arkansas. Areas north and west of San Antonio and Austin are improving, which suggests to me the GEM is projecting the front will move quicker across the Midwest and Central U.S. than other models are.
Australian Community Climate and Earth-System Simulator

Link to the original content: https://weather.us/model-charts/aus/usa/total-cloud-coverage/20240408-1800z.html
ACCESS has probably had the most dramatic change in projection over the past 12 hours. Parts of Texas and Arkansas have been upgraded slightly, and Southern Illinois and Southern Indiana are now looking favorable. Northeast Ohio has been downgraded, as have parts of Maine.
Japan Meteorological Agency
No JMA model was available for T-198.
T-198 Mean Cloud Forecast and Implications

The major change in the mean forecast in the last 12 hours is an ever-so-slight improvement in the outlook for Central Texas - not much, but trending in the right direction. Central Arkansas’ forecast has been downgraded ever so slightly, while Southern Illinois and Southern Indiana’s forecasts have improved marginally. There is now uncertainty in Northeast Ohio, but Upstate New York continues to be a safe bet. For those headed to Mazatlan, the projections do not concur entirely.
I think the takeaway here is that there is some type of weather front that will be moving through the area of totality during the eclipse. How slowly or how quickly this front moves through will strongly influence whether there are clouds or whether there are clear skies. Stay tuned!
T-198 Mean Cloud Forecast with Path of Totality
For quick reference, here is an approximate path of totality overlaid on the cloud coverage map.
I’ll be following up intermittently, so stay tuned for more in the coming days!
—————
Disclaimers: The information from weather.us included herein is done in a manner consistent with its terms and conditions, which you can read here. H.D. Hunt Photography is a noncommercial website and recognizes the copyright for this material is retained by the originator.
You can support H.D. Hunt Photography through a follow on Instagram:
Comment? Recommendation? Question?
Let us know!
Eclipse Day Cloud Coverage Model at T-210 Hours
The first forecasts of the day have been released and the models are starting to agree: things are not looking great in Texas. As usual, we will take a look at the available models (four presently) before looking at the composite.
First, the European Centre for Medium-Range Weather Forecasts Model:
European Centre for Medium-Range Weather Forecasts

Link to the original content: https://weather.us/model-charts/euro/usa/total-cloud-coverage/20240408-1800z.html
The ECMWF continues to be the most pessimistic model and is now showing nearly all of the path of totality in Texas and Mexico under heavy cloud cover on eclipse day. In addition, the once optimistic forecast for Ohio and Western New York has significantly degraded. The forecast for New England has improved, however.
Global Forecast System

Link to the original content: https://weather.us/model-charts/standard/usa/total-cloud-coverage/20240408-1800z.html
The GFS forecast, in contrast to the ECMWF, shows worsening cloud coverage over New England and Upstate New York, with continued bleakness across the remainder of the eclipse viewing zone, especially in Texas and Mazatlan.
Global Environmental Multi-Scale Model
Link to the original content: https://weather.us/model-charts/can/usa/total-cloud-coverage/20240408-1800z.html
The GEM model continues to be optimistic, having upgraded its forecast in Ohio, New England, and Arkansas for eclipse day. However, it has also significantly downgraded its forecast for Texas.
Australian Community Climate and Earth-System Simulator

Link to the original content: https://weather.us/model-charts/aus/usa/total-cloud-coverage/20240408-1800z.html
ACCESS is still showing a generally negative forecast for Texas, Arkansas, and Mazatlan. Prospects have improved for parts of Indiana, Ohio, and Upstate New York, however.
Japan Meteorological Agency
No JMA model was available for T-210.
T-210 Mean Cloud Forecast and Implications

Here is the mean of the forecasts discussed above. Generally speaking, the models are still not in much agreement and -on average- are calling for partly cloud skies across the majority of the eclipse viewing area. That said, the prospects for clear weather in Texas are not good.
As I mentioned yesterday, I’m not a meteorologist; that said, as an experience eclipse chaser I still think T-210 is too far out to start making rash decisions about travel. Even if you decided to pivot travel plans, there is currently no clear-cut favorite place to head to.
T-210 Mean Cloud Forecast with Path of Totality

For quick reference, here is an approximate path of totality overlaid on the cloud coverage map.
I’ll be following up intermittently, so stay tuned for more in the coming days!
—————
Disclaimers: The information from weather.us included herein is done in a manner consistent with its terms and conditions, which you can read here. H.D. Hunt Photography is a noncommercial website and recognizes the copyright for this material is retained by the originator.
You can support H.D. Hunt Photography through a follow on Instagram:
Comment? Recommendation? Question?
Let us know!
Eclipse Day Cloud Coverage Model at T-222 Hours
Alright, everyone: the first cloud coverage models have been released by the five major cloud predicting weather services, and -oh, boy!- do they have some wild implications for the main event on 8 April.
First, let’s take a look at the European Centre for Medium-Range Weather Forecasts Model:
European Centre for Medium-Range Weather Forecasts

Link to the original content: https://weather.us/model-charts/euro/usa/total-cloud-coverage/20240408-1800z.html
This map is showing heavy cloud coverage throughout Central Texas, as well as patchy-to-thick clouds across the Mississippi River Valley, Arkansas, parts of Indiana, and Maine. Even Mazatlan, Mexico, is projected to have some thick clouds. By contrast, Central and Northeast Ohio and Western New York are looking fantastic.
Global Forecast System

Link to the original content: https://weather.us/model-charts/standard/usa/total-cloud-coverage/20240408-1800z.html
The GFS forecast, by comparison, is extremely pessimistic and shows extremely thick cloud coverage throughout most of the range of totality besides Southern Indiana, Upstate New York, and parts of New England.
Global Environmental Multi-Scale Model

Link to the original content: https://weather.us/model-charts/can/usa/total-cloud-coverage/20240408-1800z.html
The GEM model is a bit more favorable than the ECMWF or GFS over Texas and in Mazatlan, showing patchy clouds throughout. This model generally concurs with the ECMWF model with regard to cloud coverage in the Mississippi River, Ohio, Upstate New York, and New England.
Australian Community Climate and Earth-System Simulator

Link to the original content: https://weather.us/model-charts/aus/usa/total-cloud-coverage/20240408-1800z.html
ACCESS is showing a comparatively pessimistic model, with heavy cloud coverage throughout most of the zone of totality. Mazatlan, Mexico, however looks relatively clear.
Japan Meteorological Agency

Link to the original content: https://weather.us/model-charts/jpn/usa/total-cloud-coverage/20240408-1800z.html
The JMA has arguably the rosiest forecast overall, with much of the viewing area -save Northeast Texas, Arkansas, and parts of Mexico- having a generally cloud-free afternoon.
T-222 Mean Cloud Forecast and Implications

Above you’ll see the mean of the five forecasts discussed above. We can see the forecasts overall are pretty pessimistic about Eastern and Northern Texas, as well as Arkansas. Predictions across Illinois, Indiana, and Ohio are uneven, as they are as well in Mazatlan and Maine. Upstate New York is the primary region where the models concur there will be clear skies.
I’m not a meteorologist, but I think everyone will agree 9+ days out may be a bit premature to start making dramatic decisions about changing viewing locations.
I’ll be following up intermittently, so stay tuned for more in the coming days!
—————
Disclaimers: The information from weather.us included herein is done in a manner consistent with its terms and conditions, which you can read here. H.D. Hunt Photography is a noncommercial website and recognizes the copyright for this material is retained by the originator.
You can support H.D. Hunt Photography through a follow on Instagram: