Eclipse Day Cloud Coverage Model at T-174 Hours
So you’re saying there’s a chance!
This afternoon’s models are the most interesting collection yet and may give hope to some of you who had given up on seeing totality. We also add a sixth model to the mix, the appropriately formal-sounding German Icosahedral Nonhydrostatic forecast, or ICON for short.
Let’s get into it:
European Centre for Medium-Range Weather Forecasts
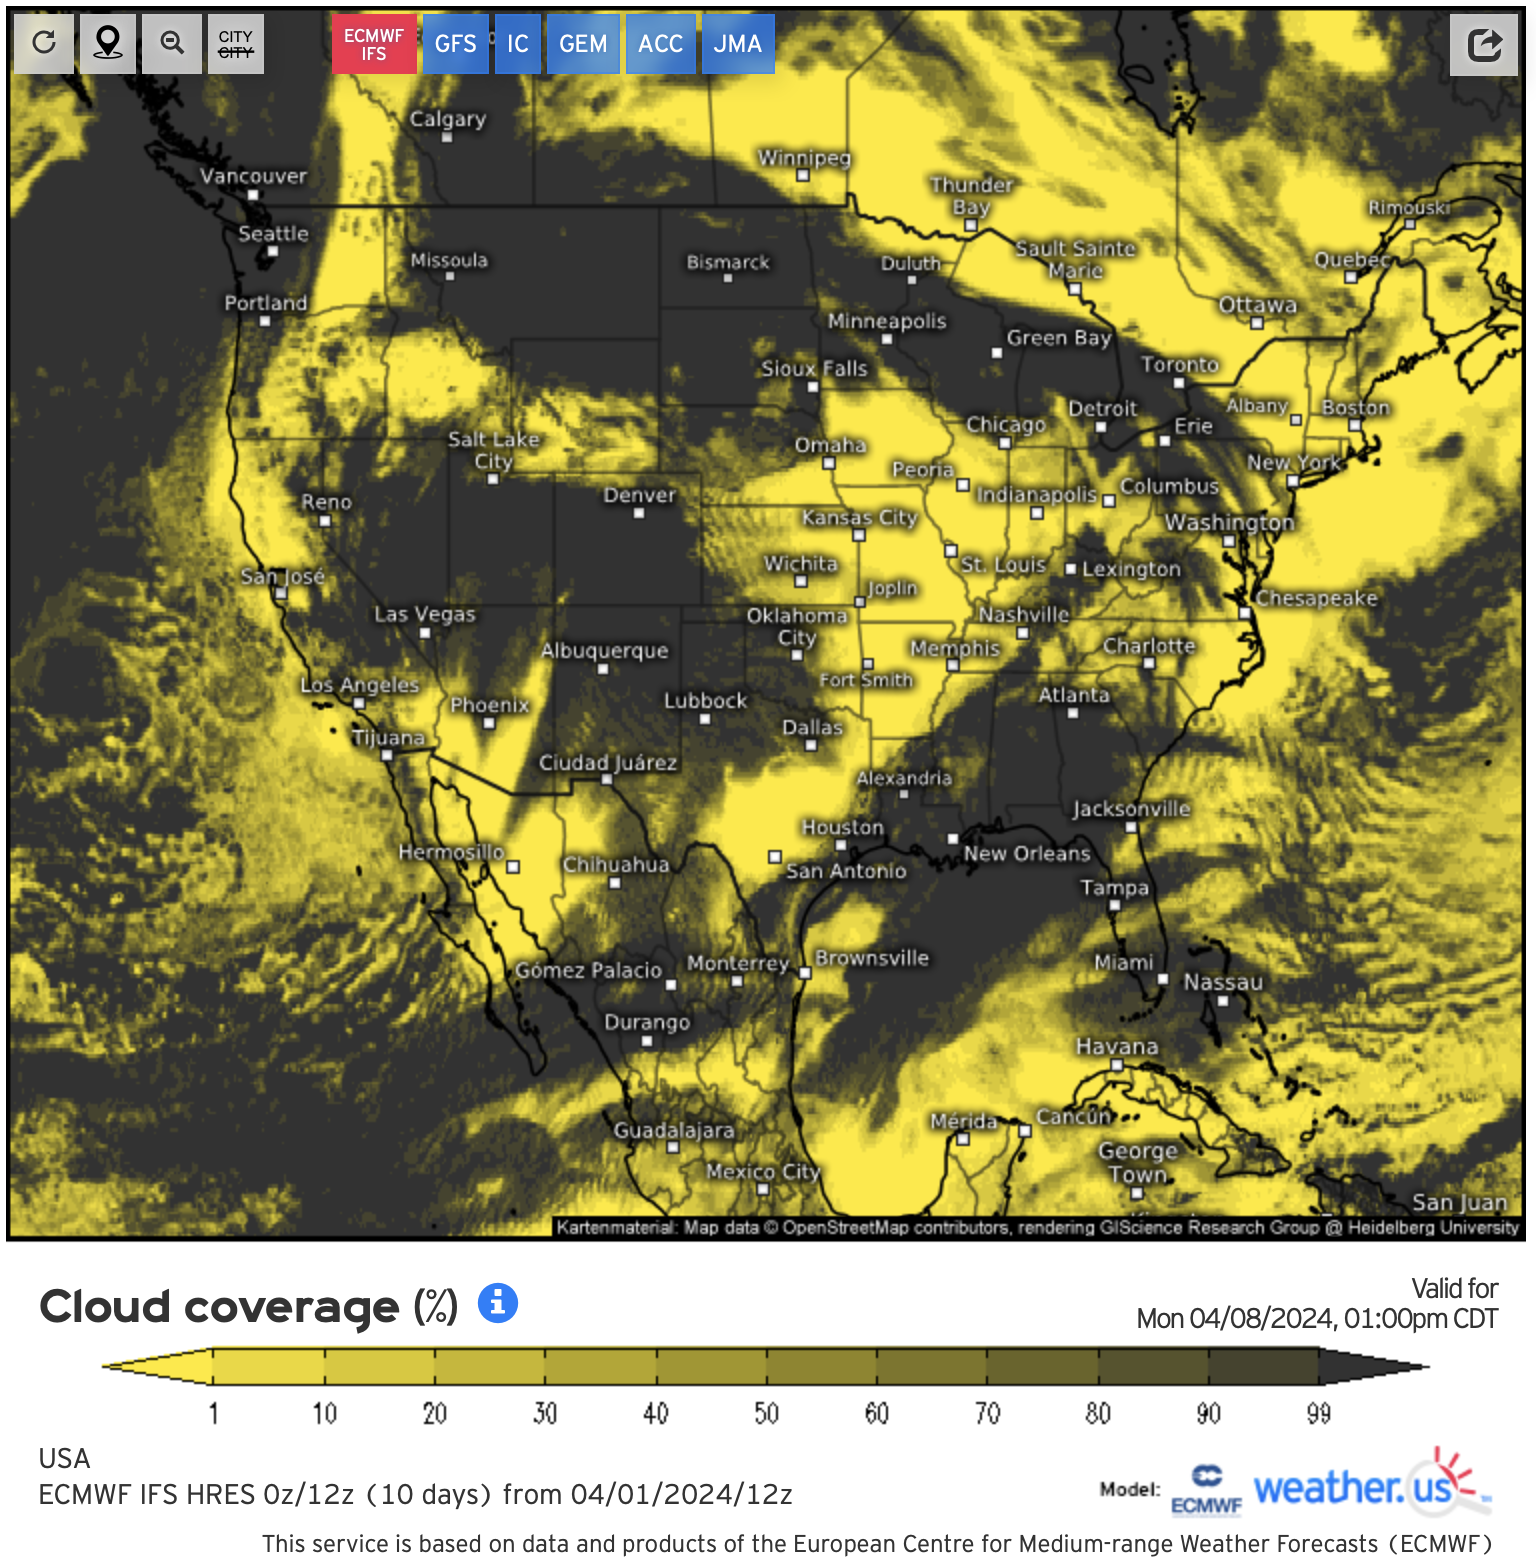
Link to the original content: https://weather.us/model-charts/euro/usa/total-cloud-coverage/20240408-1800z.html
It’s a miracle - for the first time, the ECMWF has relatively clear skies across Central Texas and Arkansas. Southern Illinois and Indiana’s forecasts have improved, while Northeast Ohio and the Buffalo Region are as uncertain as they were on the last model. Upstate New York and New England’s forecasts remain generally unchanged.
Global Forecast System

Link to the original content: https://weather.us/model-charts/standard/usa/total-cloud-coverage/20240408-1800z.html
In stark contrast, the GFS has downgraded nearly every region of totality besides Upstate New York and parts of New England to total cloud cover. This, to me, is the model to watch as its forecast has remained mostly unchanged since T-222.
Global Environmental Multi-Scale Model

Link to the original content: https://weather.us/model-charts/can/usa/total-cloud-coverage/20240408-1800z.html
In the first case of strong correlation since I started looking at these models at T-222, the GFS and the ECMWF are pretty darn close together on this one. This is good news for Texas and Arkansas, not so great news for Niagara Falls.
Australian Community Climate and Earth-System Simulator

Link to the original content: https://weather.us/model-charts/aus/usa/total-cloud-coverage/20240408-1800z.html
ACCESS didn’t change much between runs, although it is worth noting their forecast for Southern Missouri, Northern Arkansas, and the area south of Dallas has been downgraded, as has spots in Upstate New York and Maine.
Japan Meteorological Agency

Link to the original content: https://weather.us/model-charts/jpn/usa/total-cloud-coverage/20240408-1800z.html
The JMA didn’t change much between runs, with only slight improvements east of Dallas and in Northern Arkansas being noted.
Icosahedral Nonhydrostatic

Link to the original content: https://weather.us/model-charts/german/usa/total-cloud-coverage/20240408-1800z.html
ICON -a cloud model which only runs inside of seven days- is now available and, wow, this is a different perspective than we’ve gotten used to, eh? Looking forward to comparing this model in the future!
T-174 Mean Cloud Forecast and Implications

Well, this is pretty chaotic, isn’t it? Besides the Adirondacks and Vermont, there really isn’t anywhere these models seem to agree on. As I mentioned, this uncertainty is primarily the result of the models having varying opinions as to when a front will move through the Midwest.
I know I keep saying the forecast is in flux and that patience is necessary, but to show you just how wild these models are, here is the pixel maximum from the six models:

Awesome! 8 April is going to be an awesome day!
Not so fast - here’s the minimum:

Hang in there! We should hopefully have some more model agreement soon!
T-174 Mean Cloud Forecast with Path of Totality

For quick reference, here is an approximate path of totality overlaid on the cloud coverage map.
I’ll be following up intermittently, so stay tuned for more!
—————
Disclaimers: The information from weather.us included herein is done in a manner consistent with its terms and conditions, which you can read here. H.D. Hunt Photography is a noncommercial website and recognizes the copyright for this material is retained by the originator.
You can support H.D. Hunt Photography through a follow on Instagram: